Square Enix 2014 Annual Report Download - page 33
Download and view the complete annual report
Please find page 33 of the 2014 Square Enix annual report below. You can navigate through the pages in the report by either clicking on the pages listed below, or by using the keyword search tool below to find specific information within the annual report.-
 1
1 -
2
-
3
-
4
-
5
-
6
-
7
-
8
-
9
-
10
-
11
-
12
-
13
-
14
-
15
-
16
-
17
-
18
-
19
-
20
-
21
-
22
-
 23
23 -
 24
24 -
 25
25 -
 26
26 -
 27
27 -
 28
28 -
 29
29 -
 30
30 -
 31
31 -
 32
32 -
 33
33 -
 34
34 -
 35
35 -
 36
36 -
 37
37 -
 38
38 -
 39
39 -
 40
40 -
 41
41 -
 42
42 -
 43
43 -
44
-
45
-
46
-
47
-
48
-
49
-
50
-
51
-
52
-
53
-
54
-
55
-
56
-
57
-
58
-
59
-
60
-
61
-
62
-
63
-
64
-
65
-
66
-
67
-
68
-
69
-
70
-
71
-
72
-
73
-
74
 |
 |

31
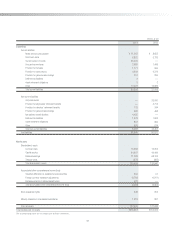
Property and Equipment Millions of yen
March 31 2014 2013 Change
¥19,917 ¥20,169 ¥(252)
Total property and equipment totaled ¥19,917 million, down ¥252 million
from the previous fiscal year, primarily due to a decrease in buildings and
structures (net) from ¥6,256 million to ¥5,719 million.
Intangible Assets Millions of yen
March 31 2014 2013 Change
¥10,835 ¥10,940 ¥(105)
Total intangible assets as of March 31, 2014, amounted to ¥10,835 million,
a decrease of ¥105 million from the previous fiscal year.
Investments and Other Assets Millions of yen
March 31 2014 2013 Change
¥12,259 ¥12,363 ¥(104)
Total investments and other assets decreased ¥104 million, to ¥12,259
million, as of March 31, 2014.
■ Liabilities Millions of yen
March 31 2014 2013 Change
¥88,940 ¥80,872 ¥8,068
As of March 31, 2014, total liabilities amounted to ¥88,940 million, an
increase of ¥8,068 million from the previous fiscal year. The main factors
contributing to the change were as follows:
Current Liabilities Millions of yen
March 31 2014 2013 Change
¥80,508 ¥37,414 ¥43,094
Total current liabilities increased ¥43,094 million, to ¥80,508 million as
of March 31, 2014. This was mainly due to an increase in current portion
of bonds to ¥35,000 million in euro yen zero convertible bonds resulting
from a classification change for bonds, which now have less than one
year until maturity.
Non-Current Liabilities Millions of yen
March 31 2014 2013 Change
¥8,432 ¥43,457 ¥(35,025)
Total non-current liabilities decreased ¥35,025 million, to ¥8,432 million, as
of March 31, 2014, primarily due to the aforementioned ¥35,000 million in
euro yen zero convertible bonds reaching maturity in less than one year.
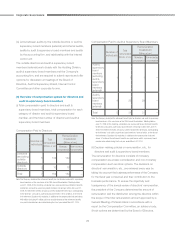
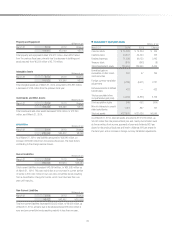
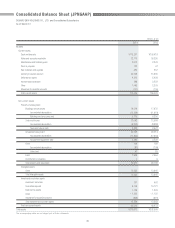
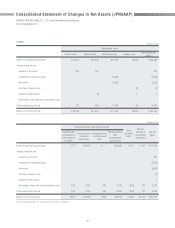
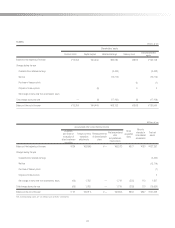
■ Shareholders’ Equity/Net Assets
Millions of yen
March 31 2014 2013 Change
Common stock ¥ 15,368 ¥ 15,204 ¥ 164
Capital surplus 44,607 44,444 163
Retained earnings 71,298 68,153 3,145
Treasury stock (870) (862) (8)
Total shareholders’ equity 130,404 126,940 3,464
Unrealized gain on
revaluation of other invest-
ment securities
253 57 196
Foreign currency translation
adjustments (4,780) (6,911) 2,131
Remeasurements of defi ned
benefi t plans 432 — 432
Total accumulated other
comprehensive gain (loss) (4,094) (6,853) 2,759
Stock acquisition rights 348 652 (304)
Minority interests in consoli-
dated subsidiaries 1,018 897 121
Total net assets ¥127,676 ¥121,636 ¥6,040
As of March 31, 2014, total net assets amounted to ¥127,676 million, up
¥6,040 million from the previous fiscal year-end, mainly due to factors such
as the recording of net income, payments of year-end dividends (¥20 per
share) for the previous fiscal year and interim dividends (¥10 per share) for
the fiscal year, and an increase in foreign currency translation adjustments.