Square Enix 2014 Annual Report Download - page 14
Download and view the complete annual report
Please find page 14 of the 2014 Square Enix annual report below. You can navigate through the pages in the report by either clicking on the pages listed below, or by using the keyword search tool below to find specific information within the annual report.-
 1
1 -
2
-
3
-
 4
4 -
 5
5 -
 6
6 -
 7
7 -
 8
8 -
 9
9 -
 10
10 -
 11
11 -
 12
12 -
 13
13 -
 14
14 -
 15
15 -
 16
16 -
 17
17 -
 18
18 -
 19
19 -
 20
20 -
 21
21 -
 22
22 -
 23
23 -
 24
24 -
25
-
26
-
27
-
28
-
29
-
30
-
31
-
32
-
33
-
34
-
35
-
36
-
37
-
38
-
39
-
40
-
41
-
42
-
43
-
44
-
45
-
46
-
47
-
48
-
49
-
50
-
51
-
52
-
53
-
54
-
55
-
56
-
57
-
58
-
59
-
60
-
61
-
62
-
63
-
64
-
65
-
66
-
67
-
68
-
69
-
70
-
71
-
72
-
73
-
74
 |
 |
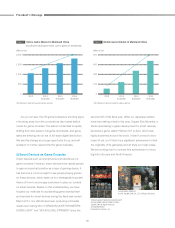
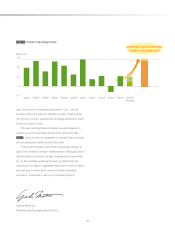
The Square Enix Group (the “Group”) is continuing determined efforts to strengthen the competitiveness and
profitability of its business segments of Digital Entertainment, Amusement, Publication and Merchandising.
Net sales for the fiscal year ended March 31, 2014 totaled ¥155,023 million (an increase of 4.8% from the
prior fiscal year); operating income amounted to ¥10,543 million (an operating loss of ¥6,081 million in the
prior fiscal year); and recurring income amounted to ¥12,534 million (a recurring loss of ¥4,378 million in the
prior fiscal year).
The compensation income (¥351 million) for the closure of an amusement facility was booked as an
extraordinary gain, and a loss on evaluation of content (¥1,725 million) was booked as an extraordinary loss as a
result of a comprehensive review on work-in-progress game titles.
These factors resulted in net income amounting to ¥6,598 million (a net loss of ¥13,714 million in the prior
fiscal year).
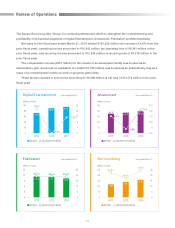
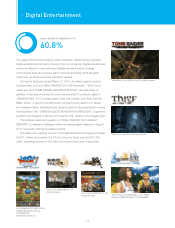
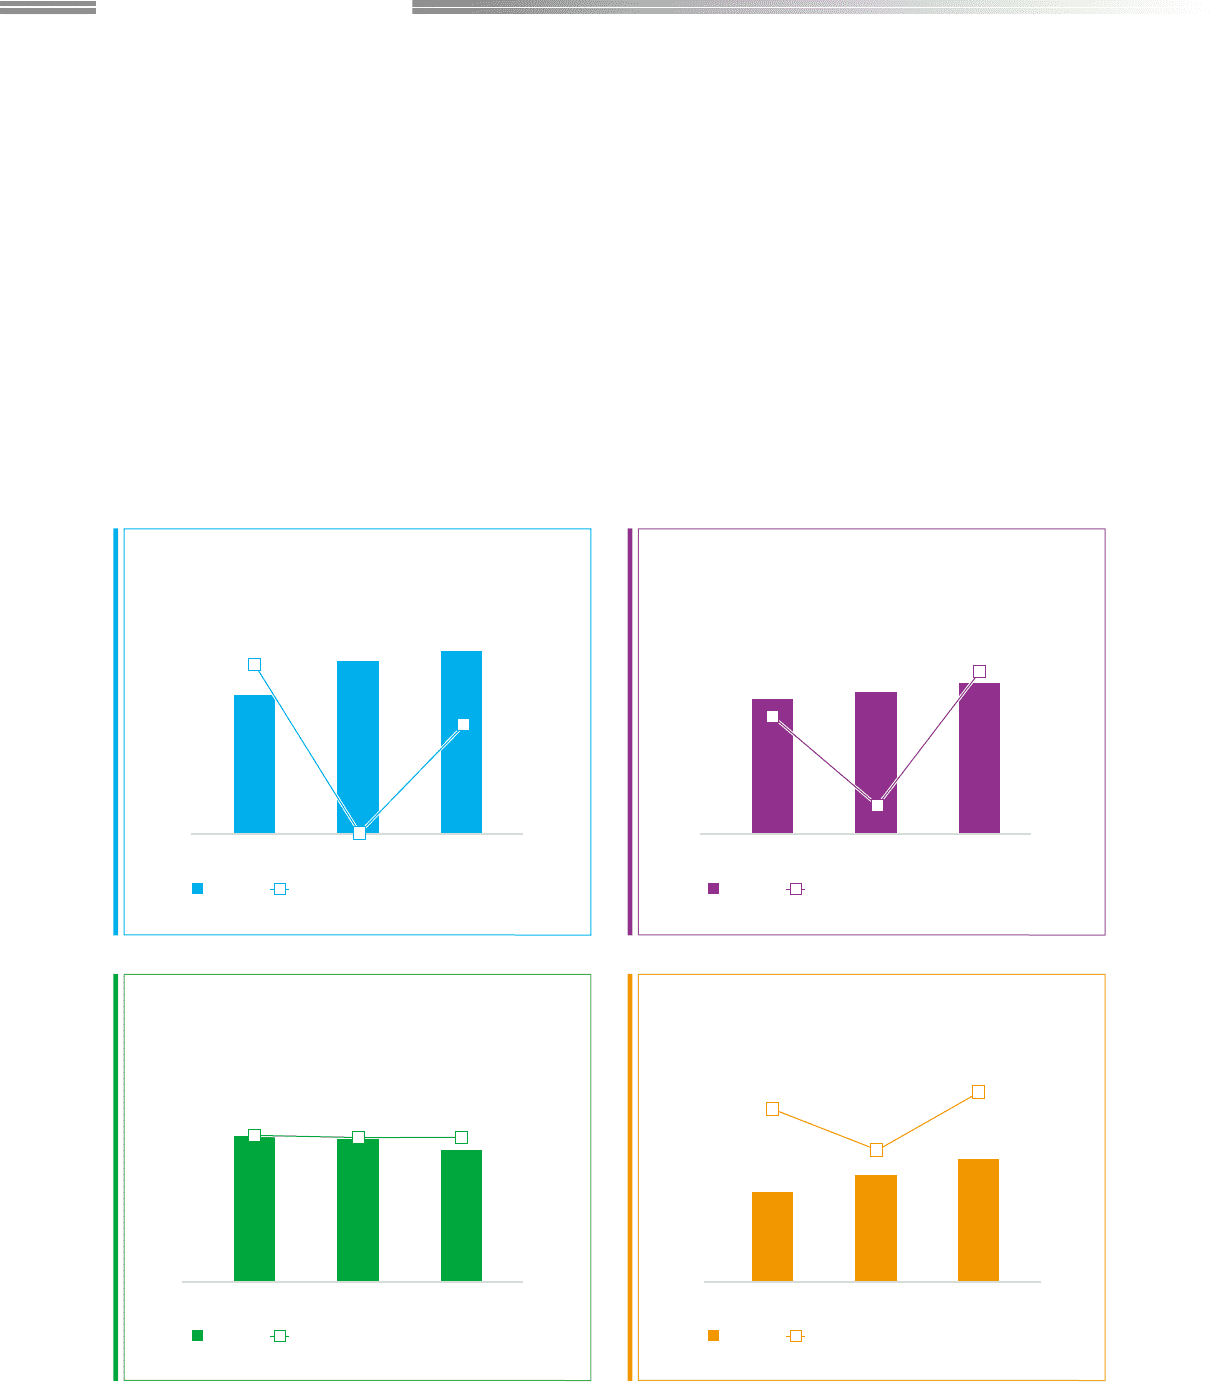
Digital Entertainment
2012 2013 2014
20
16
12
8
4
0
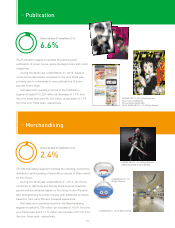
17.5%
11.3%
0.0%
71.9
89.5 94.6
100
80
60
40
20
0
(Billions of yen)
Net Sales Operating Income Margin
Publication
Amusement
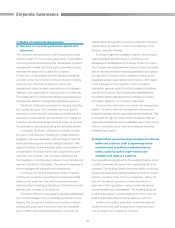
Merchandising
2012 2013 2014
12.0
9.0
6.0
3.0
0
-3.0
6.1%
9.6%
-0.8%
41.9
44.3 47.0
(Billions of yen)
60
48
36
24
12
0
Net Sales Operating Income Margin
2012 2013 2014
30
24
18
12
6
0
22.7% 22.4% 22.4%
11.3 11.1 10.2
(Billions of yen)
15
12
9
6
3
0
Net Sales Operating Income Margin
2012 2013 2014
30
24
18
12
6
0
26.8%
20.4%
29.5%
2.8
3.3
3.8
(Billions of yen)
6.0
4.8
3.6
2.4
1.2
0
Net Sales Operating Income Margin
Review of Operations
(Years ended March 31)
(Years ended March 31)
(Years ended March 31)
(Years ended March 31)
12