SkyWest Airlines 2006 Annual Report Download - page 63
Download and view the complete annual report
Please find page 63 of the 2006 SkyWest Airlines annual report below. You can navigate through the pages in the report by either clicking on the pages listed below, or by using the keyword search tool below to find specific information within the annual report.-
 1
1 -
2
-
3
-
4
-
5
-
6
-
7
-
8
-
9
-
10
-
11
-
12
-
13
-
14
-
15
-
16
-
17
-
18
-
19
-
20
-
21
-
22
-
23
-
24
-
25
-
26
-
27
-
28
-
29
-
30
-
31
-
32
-
33
-
34
-
35
-
36
-
37
-
38
-
39
-
40
-
41
-
42
-
43
-
44
-
45
-
46
-
47
-
48
-
49
-
50
-
51
-
52
-
 53
53 -
 54
54 -
 55
55 -
 56
56 -
 57
57 -
 58
58 -
 59
59 -
 60
60 -
 61
61 -
 62
62 -
 63
63 -
 64
64 -
 65
65 -
 66
66 -
 67
67 -
 68
68 -
 69
69 -
 70
70 -
 71
71 -
 72
72 -
 73
73 -
74
-
75
-
76
-
77
-
78
-
79
-
80
-
81
-
82
-
83
-
84
-
85
-
86
-
87
-
88
 |
 |

57
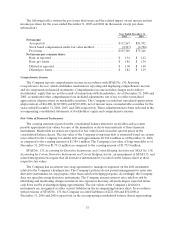
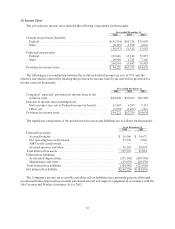
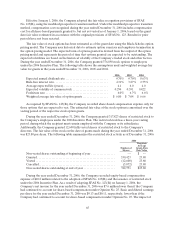
Thefollowing table contains the pro formadisclosures and the related impacton netincome andnet
incomeper sharefor the years ended December 31,2005and2004 (in thousands, except per share
information):
Year Ended December 31,
2005 2004
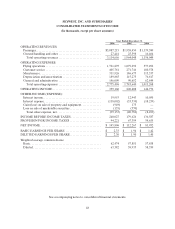
Net income:
As reported. ................................................$112,267$81,952
Stockbased compensationunder fair valuemethod..............(4,927) (6,706)
Pro forma..................................................$107,340$75,246
Net income percommonshare:
Basicasreported............................................$1.94 $1.42
Basicproforma.............................................$1.86 $1.30
Dilutedas reported ..........................................$1.90 $ 1.40
Dilutedpro forma ...........................................$1.82 $1.29
ComprehensiveIncome
The Company reportscomprehensive income in accordance with SFAS No. 130, Reporting
Comprehensive Income, which establishes standards for reporting anddisplaying comprehensive income
and its components in financial statements. Comprehensive income includes charges and credits to
stockholders’ equity that are not theresult of transactions with shareholders. As of December 31, 2006 and
2005, accumulated othercomprehensive loss included adjustments,net of tax, to reflect unrealized
appreciation (depreciation)onmarketable securities. The Companyrecorded net unrealized appreciation
(depreciation) of $61,000, $(347,000) and $(910,000), net of income taxes, on marketable securities for the
years ended December31,2006, 2005, and 2004 respectively. Theseadjustments have been reflected in the
accompanying consolidated statements of stockholders’ equity and comprehensive income.
Fair Value of Financial Instruments
Thecarrying amounts reported in the consolidated balance sheets for receivables andaccounts
payable approximatefair values because of theimmediate or short-term maturity of thesefinancial
instruments. Marketable securities are reported at fair value based on market quoted prices in the
consolidated balance sheets. Thefair value of the Company’s long-term debt is estimated based on current
ratesoffered to the Company for similar debt andapproximates$1,760.8million as of December 31,2006,
as compared to the carrying amount of $1,784.1 million. The Company’s fair value of long-term debt as of
December31,2005 was $1,751.8 million as compared to the carrying amount of $1,753.9 million.
SFAS No. 133, Accounting for DerivativeInstruments and Certain Hedging Activitiesand SFAS No. 138,
Accounting for Certain Derivative Instruments and Certain Hedging Activity,an amendment of SFAS 133, and
related interpretations require that allderivative instruments be recorded on the balance sheetat their
respective fair values.
TheCompany hasan interestrate swapagreement to manage its exposureon the debt instrument
related to theCompany’s headquarters. TheCompany’s policies do not permit managementto enterinto
derivative instruments for any purpose other than cash flow hedging purposes.Accordingly,the Company
does not speculate using derivative instruments. The Company assesses interest rate cash flow risk by
identifyingand monitoring changes in interest rate exposures that may adversely impact expected future
cash flows and by evaluatinghedging opportunities. The fair values of the Company’s derivative
instruments are recognized as other currentliabilities in the accompanying balance sheet. In accordance
with provisions of SFAS No. 133, the Company recorded liabilities of $221,000 and $344,000 at
December 31,2006 and 2005 respectively, in theaccompanying consolidated balance sheets representing