SkyWest Airlines 2006 Annual Report Download - page 37
Download and view the complete annual report
Please find page 37 of the 2006 SkyWest Airlines annual report below. You can navigate through the pages in the report by either clicking on the pages listed below, or by using the keyword search tool below to find specific information within the annual report.-
 1
1 -
2
-
3
-
4
-
5
-
6
-
7
-
8
-
9
-
10
-
11
-
12
-
13
-
14
-
15
-
16
-
17
-
18
-
19
-
20
-
21
-
22
-
23
-
24
-
25
-
26
-
 27
27 -
 28
28 -
 29
29 -
 30
30 -
 31
31 -
 32
32 -
 33
33 -
 34
34 -
 35
35 -
 36
36 -
 37
37 -
 38
38 -
 39
39 -
 40
40 -
 41
41 -
 42
42 -
 43
43 -
 44
44 -
 45
45 -
 46
46 -
 47
47 -
48
-
49
-
50
-
51
-
52
-
53
-
54
-
55
-
56
-
57
-
58
-
59
-
60
-
61
-
62
-
63
-
64
-
65
-
66
-
67
-
68
-
69
-
70
-
71
-
72
-
73
-
74
-
75
-
76
-
77
-
78
-
79
-
80
-
81
-
82
-
83
-
84
-
85
-
86
-
87
-
88
 |
 |

31
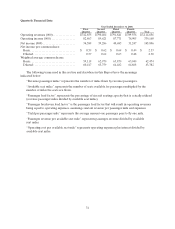
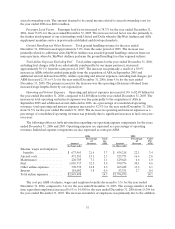
Quarterly Financial Data
Year Ended December 31, 2006
First
Quarter
Second
Quarter
Third
Quarter
Fourth
Quarter Year
Operatingrevenues (000) ................ $742,855$790,404 $791,841 $789,556 $3,114,656
Operatingincome (000)................. 82,863 89,621 87,77178,905 339,160
Net income(000)....................... 34,588 39,286 40,68531,247 145,806
Net incomepercommon share:
Basic................................ $0.59 $ 0.62 $0.64 $0.49 $2.33
Diluted..............................0.57 0.62 0.63 0.48 2.30
Weighted average common shares:
Basic: ............................... 59,118 62,970 63,87063,940 62,474
Diluted: ............................. 60,417 63,759 64,48264,868 63,382
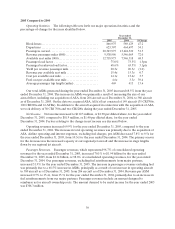
Thefollowing terms usedin this section and elsewherein this Report have the meanings
indicated below:
“Revenuepassenger miles” represents the number of miles flown by revenue passengers.
“Available seat miles” represents thenumber of seatsavailable for passengersmultiplied by the
number of miles the seats are flown.
“Passenger load factor” represents the percentageof aircraft seating capacity that is actually utilized
(revenue passenger miles divided by available seat miles).
“Passenger breakeven load factor” is the passenger load factor that will result in operating revenues
being equal to operating expenses, assuming constant revenue perpassenger mile andexpenses.
“Yield perpassenger mile”represents theaverageamountonepassenger pays to fly one mile.
“Passenger revenue per availableseat mile” represents passenger revenuedivided by available
seatmiles.
“Operating cost peravailable seat mile” representsoperating expensesplus interest divided by
available seat miles.