SkyWest Airlines 2006 Annual Report Download - page 36
Download and view the complete annual report
Please find page 36 of the 2006 SkyWest Airlines annual report below. You can navigate through the pages in the report by either clicking on the pages listed below, or by using the keyword search tool below to find specific information within the annual report.-
 1
1 -
2
-
3
-
4
-
5
-
6
-
7
-
8
-
9
-
10
-
11
-
12
-
13
-
14
-
15
-
16
-
17
-
18
-
19
-
20
-
21
-
22
-
23
-
24
-
25
-
 26
26 -
 27
27 -
 28
28 -
 29
29 -
 30
30 -
 31
31 -
 32
32 -
 33
33 -
 34
34 -
 35
35 -
 36
36 -
 37
37 -
 38
38 -
 39
39 -
 40
40 -
 41
41 -
 42
42 -
 43
43 -
 44
44 -
 45
45 -
 46
46 -
47
-
48
-
49
-
50
-
51
-
52
-
53
-
54
-
55
-
56
-
57
-
58
-
59
-
60
-
61
-
62
-
63
-
64
-
65
-
66
-
67
-
68
-
69
-
70
-
71
-
72
-
73
-
74
-
75
-
76
-
77
-
78
-
79
-
80
-
81
-
82
-
83
-
84
-
85
-
86
-
87
-
88
 |
 |

30
Selected Consolidated Financial Data (amounts in thousands, except per share data):
Year Ended December 31,
2006 2005(2) 20042003 2002
Operatingrevenues ............... $3,114,656 $1,964,048 $1,156,044 $888,026$774,447
Operatingincome. ................ 339,160 220,408 144,776108,480119,555
Income beforecumulative effect of
change in accounting principle ...145,806 112,267 81,952 66,787 78,277
Net income...................... 145,806 112,267 81,952 66,787 86,866
Net incomepercommon share:
Basic.......................... $2.33 $1.94 $1.42 $1.16 $ 1.52
Diluted........................ 2.30 1.90 1.40 1.15 1.51
Weighted average shares:
Basic.......................... 62,474 57,85157,858 57,745 57,229
Diluted........................ 63,382 58,93358,350 58,127 57,551
Total assets ...................... $3,731,419 $3,320,646 $1,662,287 $1,529,210 $999,384
Current assets .................... 1,095,454 693,632712,337 670,368513,233
Current liabilities................. 408,431 615,917 170,467151,959121,388
Long-term debt, net of current
maturities...................... 1,675,626 1,422,758 463,233462,773125,379
Stockholders’equity............... 1,178,293 913,198779,055 709,063638,686
Return on averageequity(1)....... 13.9%13.2%11.0%9.9%14.7%
Cash dividends declared per
common share ................. $0.12 $0.12 $0.12 $0.08 $ 0.08
(1)Calculated by dividing net incomebythe average of beginning and ending stockholders’ equity forthe
year
(2)OnSeptember 7, 2005, we completed theacquisition of ASA from Delta for $421.3 million in cash.
We paid $5.3 million of transaction fees and assumed approximately $1.25 billion in long-term debt
and relatedassets. Our 2005 consolidated operating revenues contain 114 days of additional revenue
and expenses generated by theASA acquisition.
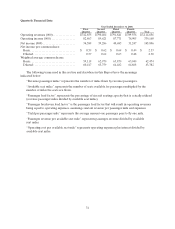
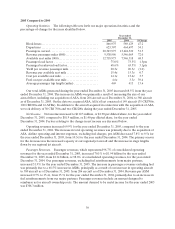
Selected Operating Data
Year Ended December 31,
20062005 2004 2003 2002
Blockhours...................... 1,298,769 866,975589,129 482,158 405,007
Departures. ...................... 857,631 623,307464,697 395,631 351,631
Passengers carried ................ 31,465,55220,343,97513,424,520 10,738,691 8,388,935
Revenuepassenger miles(000) .....15,819,1919,538,9065,546,069 4,222,669 2,990,753
Availableseat miles (000). .........20,209,88812,718,9737,546,318 5,875,029 4,356,053
Passenger load factor.............. 78.3%75.0%73.5%71.9%68.7%
Passenger break-even load factor... 72.7%68.6%65.5%63.9%58.4%
Yieldperrevenue passengermile ...19.5¢20.3¢20.5¢20.9¢25.7¢
Revenueper availableseat mile .... 15.4¢15.4¢15.3¢15.1¢17.8¢
Cost peravailable seat mile ........ 14.3¢14.1¢13.6¢13.4¢15.1¢
Averagepassengertrip length ...... 503469413393 356
Number of operating aircraftat end
of year ........................ 410380206185 149