SkyWest Airlines 2006 Annual Report Download - page 58
Download and view the complete annual report
Please find page 58 of the 2006 SkyWest Airlines annual report below. You can navigate through the pages in the report by either clicking on the pages listed below, or by using the keyword search tool below to find specific information within the annual report.-
 1
1 -
2
-
3
-
4
-
5
-
6
-
7
-
8
-
9
-
10
-
11
-
12
-
13
-
14
-
15
-
16
-
17
-
18
-
19
-
20
-
21
-
22
-
23
-
24
-
25
-
26
-
27
-
28
-
29
-
30
-
31
-
32
-
33
-
34
-
35
-
36
-
37
-
38
-
39
-
40
-
41
-
42
-
43
-
44
-
45
-
46
-
47
-
 48
48 -
 49
49 -
 50
50 -
 51
51 -
 52
52 -
 53
53 -
 54
54 -
 55
55 -
 56
56 -
 57
57 -
 58
58 -
 59
59 -
 60
60 -
 61
61 -
 62
62 -
 63
63 -
 64
64 -
 65
65 -
 66
66 -
 67
67 -
 68
68 -
69
-
70
-
71
-
72
-
73
-
74
-
75
-
76
-
77
-
78
-
79
-
80
-
81
-
82
-
83
-
84
-
85
-
86
-
87
-
88
 |
 |

52
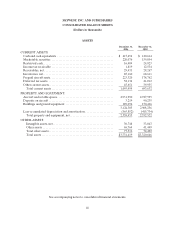
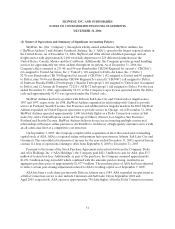
Basis of Presentation
The Company’sconsolidatedfinancial statements includethe accountsofSkyWest,Inc. andits
wholly-owned subsidiaries, SkyWest Airlines and ASA, with all inter-company transactions and balances
havingbeen eliminated.
Use of Estimates
Thepreparation of financial statements in conformity with accounting principals generally accepted in
theUnited States of America requires management to make estimatesand assumptions that affectthe
reported amounts of assets and liabilities and disclosureof contingent assets and liabilities at thedate of
the financial statements and thereported amounts of revenues and expenses duringthe reportingperiod.
Actual results could differ from those estimates.
Cash andCashEquivalents
TheCompany considers all highly liquid investments with an original maturity of three months or less
to be cash equivalents. The Company classified $16.4 million and $24.8 million of cash as restricted cash as
required by the Company’s workers’ compensation policy and includes $5.0 million in escrow from
purchaseof ASAand classified it accordingly in the consolidated balance sheets as of December 31, 2006
and 2005, respectively.
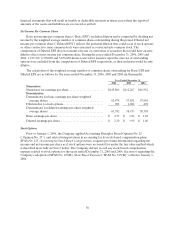
Marketable Securities
The Company’sinvestmentsinmarketabledebtand equity securities are deemed by management to
be available for sale and are reported at fair market value with thenetunrealized appreciation or
depreciation reported as acomponent of accumulated other comprehensive loss in stockholders’ equity. At
the time of sale,anyrealized appreciation or depreciation,calculated by the specific identificationmethod,
is recognized in gain (loss) on sale of marketable securities. The Company’s position in marketable
securities as of December 31, 2006 and 2005 wasas follows(inthousands):
2006 2005
Investment Types CostMarket ValueCost Market Value
Commercial paper......................$32,000 $ 32,000$—$—
Bond andbondfunds...................187,016184,769 155,192152,929
Assetbacked securities ..................3,3333,3076,167 6,125
222,349220,076 161,359159,054
Unrealized loss.........................(2,273)—(2,305)—
Total. .................................$220,076$220,076 $159,054$159,054
Marketable securities hadthefollowing maturities as of December 31, 2006 (in thousands):
Maturities Amount
Year 2007.................................................................$117,247
Years2008 through 2011 ....................................................603
Years2012 through 2016 ....................................................1,413
Thereafter .................................................................100,813
TheCompany hasclassified all marketable securities as short-term since it hasthe intentto maintain a
liquid portfolio and the ability to redeem the securities within one year.