SkyWest Airlines 2006 Annual Report Download - page 47
Download and view the complete annual report
Please find page 47 of the 2006 SkyWest Airlines annual report below. You can navigate through the pages in the report by either clicking on the pages listed below, or by using the keyword search tool below to find specific information within the annual report.-
 1
1 -
2
-
3
-
4
-
5
-
6
-
7
-
8
-
9
-
10
-
11
-
12
-
13
-
14
-
15
-
16
-
17
-
18
-
19
-
20
-
21
-
22
-
23
-
24
-
25
-
26
-
27
-
28
-
29
-
30
-
31
-
32
-
33
-
34
-
35
-
36
-
 37
37 -
 38
38 -
 39
39 -
 40
40 -
 41
41 -
 42
42 -
 43
43 -
 44
44 -
 45
45 -
 46
46 -
 47
47 -
 48
48 -
 49
49 -
 50
50 -
 51
51 -
 52
52 -
 53
53 -
 54
54 -
 55
55 -
 56
56 -
 57
57 -
58
-
59
-
60
-
61
-
62
-
63
-
64
-
65
-
66
-
67
-
68
-
69
-
70
-
71
-
72
-
73
-
74
-
75
-
76
-
77
-
78
-
79
-
80
-
81
-
82
-
83
-
84
-
85
-
86
-
87
-
88
 |
 |
41
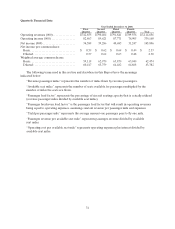
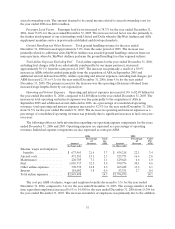
per ASM was primarily dueto the addition of ASA’s regional jetfleet andthe addition of thirty CRJ700s,
which have a lower operating cost per ASM than CRJ200s and our existingturboprop fleets.
The cost perASMformaintenance expense remained constantat 1.0¢ forthe year ended
December31,2005 and December 31, 2004. Under our United Express Agreement, specific amounts are
includedin the rates andcharges formature maintenance on regional jet enginesthat we record as
revenue. However, consistent with the direct expense maintenance policy, we recordmaintenance expense
on our CRJ200 engines as it is incurred.As a result, during the year ended December 31, 2005, we
collected and recorded as revenue$25.2 million (pretax) under the United Express Agreement, with no
material offsetto CRJ200 enginemaintenance overhauls. Because the “Maintenance” line in thetable set
forth abovedoes not includesalaries, wages and employee benefits associated with ourmaintenance
operations (those costs arestated separately in the table), the maintenance expense line in the abovetable
differs fromthe maintenance line in our Consolidated Statements of Income set forth in Item 8below.
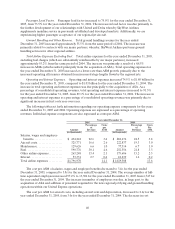
Thecost perASM for fuel increased39.4% to 4.6¢ for theyear ended December 31,2005, from 3.3¢
forthe year ended December31, 2004. This increasewas primarily due to the average price of fuel
increasing to $2.05 pergallon during theyear endedDecember31, 2005, from $1.45pergallon for the year
ended December 31, 2004.
Thecost perASM for other expenses, primarily consisting of landing fees, station rentals, computer
reservation system fees and hull and liability insurance, decreased8.7% to 2.1¢ for the year ended
December31,2005, from 2.3¢ for the year ended December 31, 2004. The decrease was primarily related
to the increase in stage lengths flown by our regional jets.
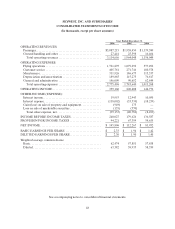
Interest expense increasedto approximately $53.3 million during the year ended December31,2005,
from approximately $18.2million during the year ended December 31, 2004. The increase in interest
expense was primarily due to the acquisition of ASA’s aircraft which are primarily financedwith
long-term debt.
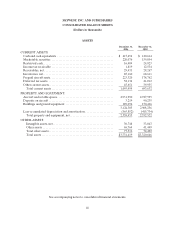
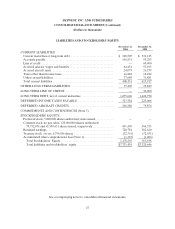
Liquidity and Capital Resources
We had working capital of $687.0 million andacurrentratio of 2.7:1 at December 31,2006, compared
to working capital of $77.7million and a current ratio of 1.1:1 at December31,2005. The increase was
principally causedby cash generated from operations during 2006, a reductionto the currentportion of
long-term debt caused primarily by refinancing aportion of the notes payable with longer termsand
proceeds from the issuance of common stock. The principal sources of cash during the year ended
December 31,2006 were $491.6 million provided by operating activities,$255.9 million in proceeds from
the saleof marketable securities, $123.1 million of proceedsfrom the issuance of long-termdebt,
$114.9 million fromthe saleof 4.0million shares common stock from apublic offeringand from the sale of
common stock in connection with the exercise of stock options underour stock option and employee stock
purchaseplans, $40.9 millionfromreturnsonaircraftdeposits and $7.3 million from proceeds from the
sale of aircraft. We purchased $317.0 million in marketablesecurities, invested $206.4 million in flight
equipment, made principal payments on long-term debt of $92.9 million, paid $90.0 million on linesof
credit, invested$38.6 million in buildings and ground equipment,paid$7.5 million in cash dividends,
invested $6.1 million in other assets and paid $0.4 million in deposits for aircraft. These factors resulted in
a$274.8 million increase in cash and cash equivalents during theyear ended December 31, 2006.
Our position in marketable securities, consisting primarily of bonds, bond funds and commercial
paper, increasedto $220.1 million at December 31, 2006, compared to $159 million at December 31, 2005.
Theincrease in marketable securities was due primarily to cash generated fromoperations in 2006 that
were invested in marketable securities.