Singapore Airlines 2013 Annual Report Download - page 93
Download and view the complete annual report
Please find page 93 of the 2013 Singapore Airlines annual report below. You can navigate through the pages in the report by either clicking on the pages listed below, or by using the keyword search tool below to find specific information within the annual report.-
 1
1 -
2
-
3
-
4
-
5
-
6
-
7
-
8
-
9
-
10
-
11
-
12
-
13
-
14
-
15
-
16
-
17
-
18
-
19
-
20
-
21
-
22
-
23
-
24
-
25
-
26
-
27
-
28
-
29
-
30
-
31
-
32
-
33
-
34
-
35
-
36
-
37
-
38
-
39
-
40
-
41
-
42
-
43
-
44
-
45
-
46
-
47
-
48
-
49
-
50
-
51
-
52
-
53
-
54
-
55
-
56
-
57
-
58
-
59
-
60
-
61
-
62
-
63
-
64
-
65
-
66
-
67
-
68
-
69
-
70
-
71
-
72
-
73
-
74
-
75
-
76
-
77
-
78
-
79
-
80
-
81
-
82
-
 83
83 -
 84
84 -
 85
85 -
 86
86 -
 87
87 -
 88
88 -
 89
89 -
 90
90 -
 91
91 -
 92
92 -
 93
93 -
 94
94 -
 95
95 -
 96
96 -
 97
97 -
 98
98 -
 99
99 -
 100
100 -
 101
101 -
 102
102 -
 103
103 -
104
-
105
-
106
-
107
-
108
-
109
-
110
-
111
-
112
-
113
-
114
-
115
-
116
-
117
-
118
-
119
-
120
-
121
-
122
-
123
-
124
-
125
-
126
-
127
-
128
-
129
-
130
-
131
-
132
-
133
-
134
-
135
-
136
-
137
-
138
-
139
-
140
-
141
-
142
-
143
-
144
-
145
-
146
-
147
-
148
-
149
-
150
-
151
-
152
-
153
-
154
-
155
-
156
-
157
-
158
-
159
-
160
-
161
-
162
-
163
-
164
-
165
-
166
-
167
-
168
-
169
-
170
-
171
-
172
-
173
-
174
-
175
-
176
-
177
-
178
-
179
-
180
-
181
-
182
-
183
-
184
-
185
-
186
-
187
-
188
-
189
-
190
-
191
-
192
-
193
-
194
-
195
-
196
-
197
-
198
-
199
-
200
-
201
-
202
-
203
-
204
-
205
-
206
-
207
-
208
-
209
-
210
 |
 |

091
ANNUAL REPORT 2012/13
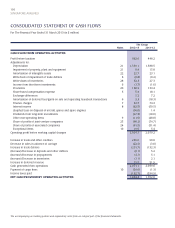
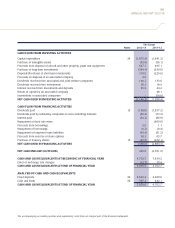
CONSOLIDATED PROFIT AND LOSS ACCOUNT
For The Financial Year Ended 31 March 2013 (in $ million)
The Group
Notes 2012-13 2011-12
REVENUE 15,098.2 14,857.8
EXPENDITURE
Staff costs 5 2,353.3 2,194.4
Fuel costs 5,899.4 5,803.4
Depreciation 21 1,589.1 1,588.5
Impairment of property, plant and equipment 21 9.8 15.8
Amortisation of intangible assets 22 22.7 23.1
Aircraft maintenance and overhaul costs 539.3 463.4
Commission and incentives 355.5 330.9
Landing, parking and overflying charges 687.8 668.6
Handling charges 1,006.1 1,012.8
Rentals on leased aircraft 553.6 573.7
Material costs 214.2 219.0
Inflight meals 543.1 480.5
Advertising and sales costs 209.3 201.6
Insurance expenses 43.3 46.8
Company accommodation and utilities 115.6 113.9
Other passenger costs 158.4 139.3
Crew expenses 148.2 140.8
Other operating expenses 420.3 555.4
14,869.0 14,571.9
OPERATING PROFIT 6 229.2 285.9
Finance charges 7 (42.7) (74.3)
Interest income 8 62.5 50.5
Surplus/(Loss) on disposal of aircraft, spares and spare engines 56.0 (1.4)
Dividends from long-term investments 27.3 18.0
Other non-operating items 9 11.9 48.8
Share of profits of joint venture companies 25 96.2 74.7
Share of profits of associated companies 24 61.5 51.4
PROFIT BEFORE EXCEPTIONAL ITEMS 501.9 453.6
EXCEPTIONAL ITEMS 10 (19.9) (5.4)
PROFIT BEFORE TAXATION 482.0 448.2
TAXATION 11 (40.4) (51.4)
PROFIT FOR THE FINANCIAL YEAR 441.6 396.8
PROFIT ATTRIBUTABLE TO:
OWNERS OF THE PARENT 378.9 335.9
NON-CONTROLLING INTERESTS 62.7 60.9
441.6 396.8
BASIC EARNINGS PER SHARE (CENTS) 12 32.2 28.3
DILUTED EARNINGS PER SHARE (CENTS) 12 31.9 27.9
The accompanying accounting policies and explanatory notes form an integral part of the financial statements.