Singapore Airlines 2013 Annual Report Download - page 161
Download and view the complete annual report
Please find page 161 of the 2013 Singapore Airlines annual report below. You can navigate through the pages in the report by either clicking on the pages listed below, or by using the keyword search tool below to find specific information within the annual report.-
 1
1 -
2
-
3
-
4
-
5
-
6
-
7
-
8
-
9
-
10
-
11
-
12
-
13
-
14
-
15
-
16
-
17
-
18
-
19
-
20
-
21
-
22
-
23
-
24
-
25
-
26
-
27
-
28
-
29
-
30
-
31
-
32
-
33
-
34
-
35
-
36
-
37
-
38
-
39
-
40
-
41
-
42
-
43
-
44
-
45
-
46
-
47
-
48
-
49
-
50
-
51
-
52
-
53
-
54
-
55
-
56
-
57
-
58
-
59
-
60
-
61
-
62
-
63
-
64
-
65
-
66
-
67
-
68
-
69
-
70
-
71
-
72
-
73
-
74
-
75
-
76
-
77
-
78
-
79
-
80
-
81
-
82
-
83
-
84
-
85
-
86
-
87
-
88
-
89
-
90
-
91
-
92
-
93
-
94
-
95
-
96
-
97
-
98
-
99
-
100
-
101
-
102
-
103
-
104
-
105
-
106
-
107
-
108
-
109
-
110
-
111
-
112
-
113
-
114
-
115
-
116
-
117
-
118
-
119
-
120
-
121
-
122
-
123
-
124
-
125
-
126
-
127
-
128
-
129
-
130
-
131
-
132
-
133
-
134
-
135
-
136
-
137
-
138
-
139
-
140
-
141
-
142
-
143
-
144
-
145
-
146
-
147
-
148
-
149
-
150
-
 151
151 -
 152
152 -
 153
153 -
 154
154 -
 155
155 -
 156
156 -
 157
157 -
 158
158 -
 159
159 -
 160
160 -
 161
161 -
 162
162 -
 163
163 -
 164
164 -
 165
165 -
 166
166 -
 167
167 -
 168
168 -
 169
169 -
 170
170 -
 171
171 -
172
-
173
-
174
-
175
-
176
-
177
-
178
-
179
-
180
-
181
-
182
-
183
-
184
-
185
-
186
-
187
-
188
-
189
-
190
-
191
-
192
-
193
-
194
-
195
-
196
-
197
-
198
-
199
-
200
-
201
-
202
-
203
-
204
-
205
-
206
-
207
-
208
-
209
-
210
 |
 |

159
ANNUAL REPORT 2012/13
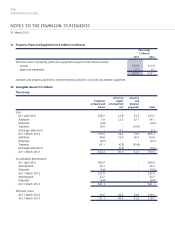
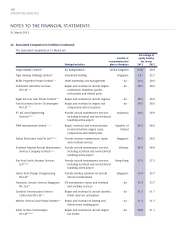
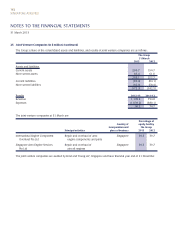
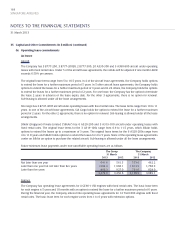
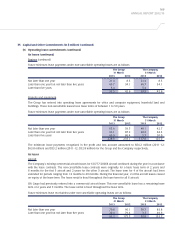
24 Associated Companies (in $ million) (continued)
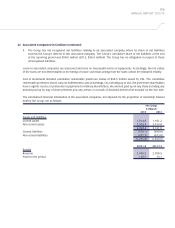
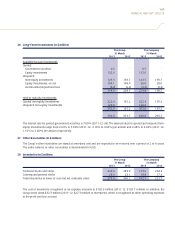
4. The Group has not recognised net liabilities relating to an associated company where its share of net liabilities
exceeds the Group’s interest in this associated company. The Group’s cumulative share of net liabilities at the end
of the reporting period was $98.6 million (2012: $96.4 million). The Group has no obligation in respect of these
unrecognised liabilities.
Loans to associated companies are unsecured and have no foreseeable terms of repayments. Accordingly, the fair values
of the loans are not determinable as the timing of future cash flows arising from the loans cannot be estimated reliably.
Cost of investment included cumulative redeemable preference shares of $66.5 million issued by VAL. The cumulative
redeemable preference shares carry no entitlement to vote at meetings. On a winding up of VAL, the preference shareholders
have a right to receive, in preference to payments to ordinary shareholders, the amount paid up on any share including any
amount paid up by way of share premium plus any arrears or accruals of dividend declared but not paid on the due date.
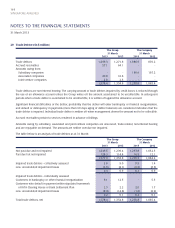
The summarised financial information of the associated companies, not adjusted for the proportion of ownership interest
held by the Group, are as follows:
The Group
31 March
2013 2012
Assets and liabilities
Current assets 1,014.8 1,101.2
Non-current assets 2,033.4 2,019.8
3,048.2 3,121.0
Current liabilities (578.1) (690.8)
Non-current liabilities (677.7) (673.8)
(1,255.8) (1,364.6)
2012-13 2011-12
Results
Revenue 2,409.5 2,708.9
Profit for the period 126.5 74.1