Singapore Airlines 2013 Annual Report Download - page 130
Download and view the complete annual report
Please find page 130 of the 2013 Singapore Airlines annual report below. You can navigate through the pages in the report by either clicking on the pages listed below, or by using the keyword search tool below to find specific information within the annual report.-
 1
1 -
2
-
3
-
4
-
5
-
6
-
7
-
8
-
9
-
10
-
11
-
12
-
13
-
14
-
15
-
16
-
17
-
18
-
19
-
20
-
21
-
22
-
23
-
24
-
25
-
26
-
27
-
28
-
29
-
30
-
31
-
32
-
33
-
34
-
35
-
36
-
37
-
38
-
39
-
40
-
41
-
42
-
43
-
44
-
45
-
46
-
47
-
48
-
49
-
50
-
51
-
52
-
53
-
54
-
55
-
56
-
57
-
58
-
59
-
60
-
61
-
62
-
63
-
64
-
65
-
66
-
67
-
68
-
69
-
70
-
71
-
72
-
73
-
74
-
75
-
76
-
77
-
78
-
79
-
80
-
81
-
82
-
83
-
84
-
85
-
86
-
87
-
88
-
89
-
90
-
91
-
92
-
93
-
94
-
95
-
96
-
97
-
98
-
99
-
100
-
101
-
102
-
103
-
104
-
105
-
106
-
107
-
108
-
109
-
110
-
111
-
112
-
113
-
114
-
115
-
116
-
117
-
118
-
119
-
 120
120 -
 121
121 -
 122
122 -
 123
123 -
 124
124 -
 125
125 -
 126
126 -
 127
127 -
 128
128 -
 129
129 -
 130
130 -
 131
131 -
 132
132 -
 133
133 -
 134
134 -
 135
135 -
 136
136 -
 137
137 -
 138
138 -
 139
139 -
 140
140 -
141
-
142
-
143
-
144
-
145
-
146
-
147
-
148
-
149
-
150
-
151
-
152
-
153
-
154
-
155
-
156
-
157
-
158
-
159
-
160
-
161
-
162
-
163
-
164
-
165
-
166
-
167
-
168
-
169
-
170
-
171
-
172
-
173
-
174
-
175
-
176
-
177
-
178
-
179
-
180
-
181
-
182
-
183
-
184
-
185
-
186
-
187
-
188
-
189
-
190
-
191
-
192
-
193
-
194
-
195
-
196
-
197
-
198
-
199
-
200
-
201
-
202
-
203
-
204
-
205
-
206
-
207
-
208
-
209
-
210
 |
 |

128
SINGAPORE AIRLINES
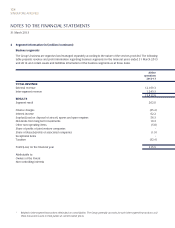
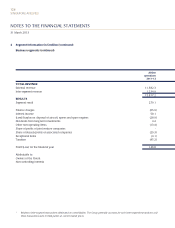
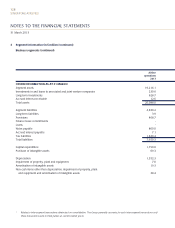
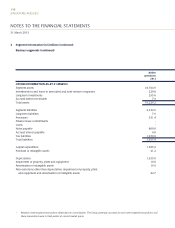
NOTES TO THE FINANCIAL STATEMENTS
Airline
operations
2013
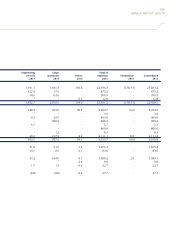
OTHER INFORMATION AS AT 31 MARCH
Segment assets 19,216.1
Investments in and loans to associated and joint venture companies 230.6
Long-term investments 628.7
Accrued interest receivable 12.6
Total assets 20,088.0
Segment liabilities 4,830.2
Long-term liabilities 3.9
Provisions 468.7
Finance lease commitments -
Loans -
Notes payable 800.0
Accrued interest payable 7.1
Tax liabilities 1,840.4
Total liabilities 7,950.3
Capital expenditure 1,790.6
Purchase of intangible assets 69.3
Depreciation 1,352.3
Impairment of property, plant and equipment 7.0
Amortisation of intangible assets 19.3
Non-cash items other than depreciation, impairment of property, plant
and equipment and amortisation of intangible assets 38.4
* Relates to inter-segment transactions eliminated on consolidation. The Group generally accounts for such inter-segment transactions as if
these transactions were to third parties at current market prices.
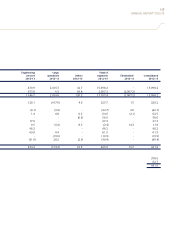
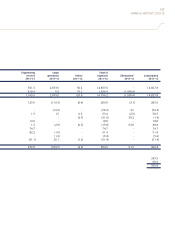
4 Segment Information (in $ million) (continued)
Business segments (continued)
31 March 2013