Singapore Airlines 2013 Annual Report Download - page 143
Download and view the complete annual report
Please find page 143 of the 2013 Singapore Airlines annual report below. You can navigate through the pages in the report by either clicking on the pages listed below, or by using the keyword search tool below to find specific information within the annual report.-
 1
1 -
2
-
3
-
4
-
5
-
6
-
7
-
8
-
9
-
10
-
11
-
12
-
13
-
14
-
15
-
16
-
17
-
18
-
19
-
20
-
21
-
22
-
23
-
24
-
25
-
26
-
27
-
28
-
29
-
30
-
31
-
32
-
33
-
34
-
35
-
36
-
37
-
38
-
39
-
40
-
41
-
42
-
43
-
44
-
45
-
46
-
47
-
48
-
49
-
50
-
51
-
52
-
53
-
54
-
55
-
56
-
57
-
58
-
59
-
60
-
61
-
62
-
63
-
64
-
65
-
66
-
67
-
68
-
69
-
70
-
71
-
72
-
73
-
74
-
75
-
76
-
77
-
78
-
79
-
80
-
81
-
82
-
83
-
84
-
85
-
86
-
87
-
88
-
89
-
90
-
91
-
92
-
93
-
94
-
95
-
96
-
97
-
98
-
99
-
100
-
101
-
102
-
103
-
104
-
105
-
106
-
107
-
108
-
109
-
110
-
111
-
112
-
113
-
114
-
115
-
116
-
117
-
118
-
119
-
120
-
121
-
122
-
123
-
124
-
125
-
126
-
127
-
128
-
129
-
130
-
131
-
132
-
 133
133 -
 134
134 -
 135
135 -
 136
136 -
 137
137 -
 138
138 -
 139
139 -
 140
140 -
 141
141 -
 142
142 -
 143
143 -
 144
144 -
 145
145 -
 146
146 -
 147
147 -
 148
148 -
 149
149 -
 150
150 -
 151
151 -
 152
152 -
 153
153 -
154
-
155
-
156
-
157
-
158
-
159
-
160
-
161
-
162
-
163
-
164
-
165
-
166
-
167
-
168
-
169
-
170
-
171
-
172
-
173
-
174
-
175
-
176
-
177
-
178
-
179
-
180
-
181
-
182
-
183
-
184
-
185
-
186
-
187
-
188
-
189
-
190
-
191
-
192
-
193
-
194
-
195
-
196
-
197
-
198
-
199
-
200
-
201
-
202
-
203
-
204
-
205
-
206
-
207
-
208
-
209
-
210
 |
 |

141
ANNUAL REPORT 2012/13
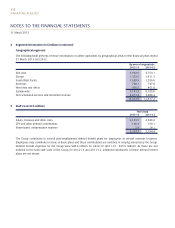
10 Exceptional Items (in $ million)
During the financial year, the Group’s exceptional items pertained to provision for penalties and costs agreed between
Singapore Airlines Cargo (“SIA Cargo”) and the Australian Competition and Consumer Commission for an amount
of AUD12.2 million ($15.5 million) and the New Zealand Commerce Commission for an amount of NZD4.4 million
($4.4 million). The penalties and costs were recommended by the parties and endorsed by the respective Courts, bringing
the Commissions’ air cargo investigations and proceedings in Australia and New Zealand to a close for SIA Cargo.
During the previous financial year, the Company and SIA Cargo accepted a settlement offer from the plaintiffs in the
Canadian air cargo class actions to resolve all such actions on an agreed basis for an amount of CAD1.05 million
($1.3 million). The settlement is without admission of any wrongdoing or liability and has been approved by the relevant
courts in Canada and is final.
With regard to an investigation conducted by the South African Competition Commission (“SACC”) concerning price-
fixing on certain routes, a settlement agreement was reached which included an administrative penalty of ZAR25 million
($4.1 million). The Competition Tribunal confirmed the settlement agreement between the Company and the SACC and the
Company has paid the agreed upon administrative penalty during the financial year.
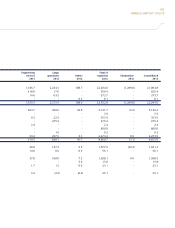
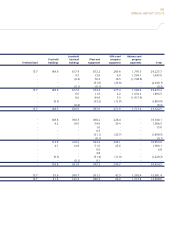
11 Taxation (in $ million)
Major components of income tax expense
The major components of income tax expense for the years ended 31 March 2013 and 2012 are:
The Group
2012-13 2011-12
Current taxation
Provision for the year 122.3 199.2
Overprovision in respect of prior years (6.8) (0.1)
Share of joint venture companies’ taxation 1.3 1.2
Share of associated companies’ taxation 11.7 13.7
128.5 214.0
Deferred taxation
Movement in temporary differences (62.9) (139.5)
Overprovision in respect of prior years (25.2) (23.1)
(88.1) (162.6)
40.4 51.4
Deferred taxation related to other comprehensive income:
The Group
2012-13 2011-12
Available-for-sale financial assets 1.1 (0.4)
Cash flow hedges 1.5 11.0
Share of comprehensive income of associated and joint venture companies - 0.2
2.6 10.8