Singapore Airlines 2013 Annual Report Download - page 136
Download and view the complete annual report
Please find page 136 of the 2013 Singapore Airlines annual report below. You can navigate through the pages in the report by either clicking on the pages listed below, or by using the keyword search tool below to find specific information within the annual report.-
 1
1 -
2
-
3
-
4
-
5
-
6
-
7
-
8
-
9
-
10
-
11
-
12
-
13
-
14
-
15
-
16
-
17
-
18
-
19
-
20
-
21
-
22
-
23
-
24
-
25
-
26
-
27
-
28
-
29
-
30
-
31
-
32
-
33
-
34
-
35
-
36
-
37
-
38
-
39
-
40
-
41
-
42
-
43
-
44
-
45
-
46
-
47
-
48
-
49
-
50
-
51
-
52
-
53
-
54
-
55
-
56
-
57
-
58
-
59
-
60
-
61
-
62
-
63
-
64
-
65
-
66
-
67
-
68
-
69
-
70
-
71
-
72
-
73
-
74
-
75
-
76
-
77
-
78
-
79
-
80
-
81
-
82
-
83
-
84
-
85
-
86
-
87
-
88
-
89
-
90
-
91
-
92
-
93
-
94
-
95
-
96
-
97
-
98
-
99
-
100
-
101
-
102
-
103
-
104
-
105
-
106
-
107
-
108
-
109
-
110
-
111
-
112
-
113
-
114
-
115
-
116
-
117
-
118
-
119
-
120
-
121
-
122
-
123
-
124
-
125
-
 126
126 -
 127
127 -
 128
128 -
 129
129 -
 130
130 -
 131
131 -
 132
132 -
 133
133 -
 134
134 -
 135
135 -
 136
136 -
 137
137 -
 138
138 -
 139
139 -
 140
140 -
 141
141 -
 142
142 -
 143
143 -
 144
144 -
 145
145 -
 146
146 -
147
-
148
-
149
-
150
-
151
-
152
-
153
-
154
-
155
-
156
-
157
-
158
-
159
-
160
-
161
-
162
-
163
-
164
-
165
-
166
-
167
-
168
-
169
-
170
-
171
-
172
-
173
-
174
-
175
-
176
-
177
-
178
-
179
-
180
-
181
-
182
-
183
-
184
-
185
-
186
-
187
-
188
-
189
-
190
-
191
-
192
-
193
-
194
-
195
-
196
-
197
-
198
-
199
-
200
-
201
-
202
-
203
-
204
-
205
-
206
-
207
-
208
-
209
-
210
 |
 |

134
SINGAPORE AIRLINES
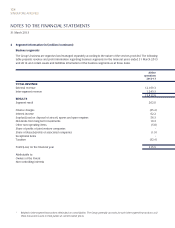
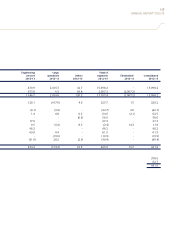
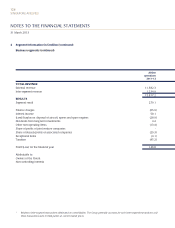
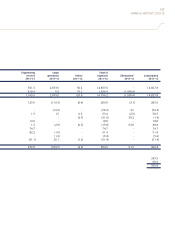
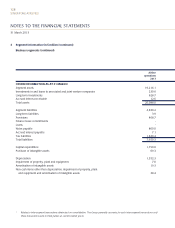
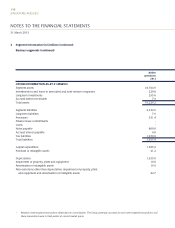
NOTES TO THE FINANCIAL STATEMENTS
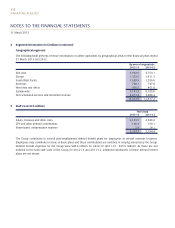
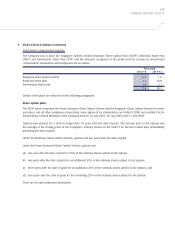
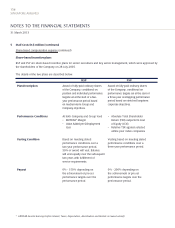
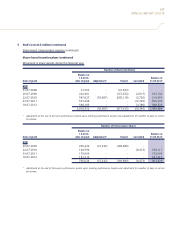
5 Staff Costs (in $ million) (continued)
Share-based compensation expense (continued)
Share option plans (continued)
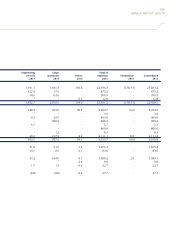
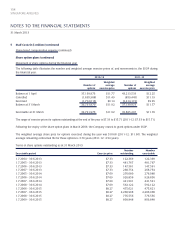
Movement of share options during the financial year
The following table illustrates the number and weighted average exercise prices of, and movements in, the ESOP during
the financial year:
2012-13 2011-12
Weighted Weighted
Number of average Number of average
options exercise price options exercise price
Balance at 1 April 37,139,973 $11.77 43,213,533 $12.25
Cancelled (1,695,988) $11.49 (859,445) $11.19
Exercised (1,712,015) $9.14 (5,214,115) $9.95
Balance at 31 March 33,731,970 $11.92 37,139,973 $11.77
Exercisable at 31 March 33,731,970 $11.92 35,865,297 $11.76
The range of exercise prices for options outstanding at the end of the year is $7.33 to $15.71 (2011-12: $7.33 to $15.71).
Following the expiry of the share option plans in March 2009, the Company ceased to grant options under ESOP.
The weighted average share price for options exercised during the year was $10.68 (2011-12: $11.90). The weighted
average remaining contractual life for these options is 3.79 years (2011-12: 4.54 years).
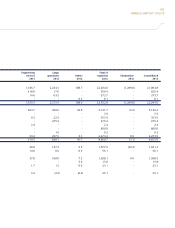
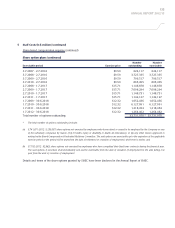
Terms of share options outstanding as at 31 March 2013:
Number Number
Exercisable period Exercise price outstanding exercisable
1.7.2004 - 30.6.2013 $7.33 122,369 122,369
1.7.2005 - 30.6.2013 $7.33 481,767 481,767
1.7.2006 - 30.6.2013 $7.33 147,561 147,561
1.7.2007 - 30.6.2013 $7.33 268,754 268,754
1.7.2005 - 30.6.2014 $7.69 276,080 276,080
1.7.2006 - 30.6.2014 $7.69 926,856 926,856
1.7.2007 - 30.6.2014 $7.69 441,591 441,591
1.7.2008 - 30.6.2014 $7.69 592,122 592,122
1.7.2006 - 30.6.2015 $8.27 475,621 475,621
1.7.2007 - 30.6.2015 $8.27 2,200,908 2,200,908
1.7.2008 - 30.6.2015 $8.27 776,556 776,556
1.7.2009 - 30.6.2015 $8.27 809,848 809,848
31 March 2013