Singapore Airlines 2013 Annual Report Download - page 79
Download and view the complete annual report
Please find page 79 of the 2013 Singapore Airlines annual report below. You can navigate through the pages in the report by either clicking on the pages listed below, or by using the keyword search tool below to find specific information within the annual report.-
 1
1 -
2
-
3
-
4
-
5
-
6
-
7
-
8
-
9
-
10
-
11
-
12
-
13
-
14
-
15
-
16
-
17
-
18
-
19
-
20
-
21
-
22
-
23
-
24
-
25
-
26
-
27
-
28
-
29
-
30
-
31
-
32
-
33
-
34
-
35
-
36
-
37
-
38
-
39
-
40
-
41
-
42
-
43
-
44
-
45
-
46
-
47
-
48
-
49
-
50
-
51
-
52
-
53
-
54
-
55
-
56
-
57
-
58
-
59
-
60
-
61
-
62
-
63
-
64
-
65
-
66
-
67
-
68
-
 69
69 -
 70
70 -
 71
71 -
 72
72 -
 73
73 -
 74
74 -
 75
75 -
 76
76 -
 77
77 -
 78
78 -
 79
79 -
 80
80 -
 81
81 -
 82
82 -
 83
83 -
 84
84 -
 85
85 -
 86
86 -
 87
87 -
 88
88 -
 89
89 -
90
-
91
-
92
-
93
-
94
-
95
-
96
-
97
-
98
-
99
-
100
-
101
-
102
-
103
-
104
-
105
-
106
-
107
-
108
-
109
-
110
-
111
-
112
-
113
-
114
-
115
-
116
-
117
-
118
-
119
-
120
-
121
-
122
-
123
-
124
-
125
-
126
-
127
-
128
-
129
-
130
-
131
-
132
-
133
-
134
-
135
-
136
-
137
-
138
-
139
-
140
-
141
-
142
-
143
-
144
-
145
-
146
-
147
-
148
-
149
-
150
-
151
-
152
-
153
-
154
-
155
-
156
-
157
-
158
-
159
-
160
-
161
-
162
-
163
-
164
-
165
-
166
-
167
-
168
-
169
-
170
-
171
-
172
-
173
-
174
-
175
-
176
-
177
-
178
-
179
-
180
-
181
-
182
-
183
-
184
-
185
-
186
-
187
-
188
-
189
-
190
-
191
-
192
-
193
-
194
-
195
-
196
-
197
-
198
-
199
-
200
-
201
-
202
-
203
-
204
-
205
-
206
-
207
-
208
-
209
-
210
 |
 |

077
ANNUAL REPORT 2012/13
Performance of the Company (continued)
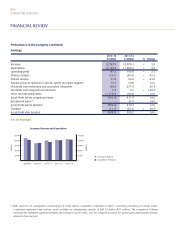
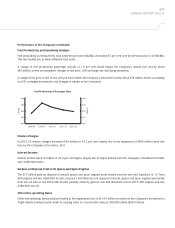
Fuel Productivity and Sensitivity Analysis
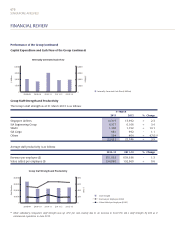
Fuel productivity as measured by load tonne-km per barrel (ltk/BBL) decreased 0.5 per cent over the previous year to 419ltk/BBL.
This was mainly due to lower bellyhold load factor.
A change in fuel productivity (passenger aircraft) of 1.0 per cent would impact the Company’s annual fuel cost by about
$50 million, before accounting for changes in fuel price, USD exchange rate and flying operations.
A change in the price of fuel of one USD per barrel affects the Company’s annual fuel cost by about $38 million, before accounting
for USD exchange movements, and changes in volume of fuel consumed.
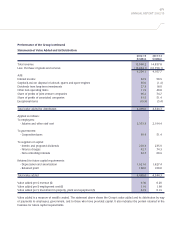
Finance Charges
In 2012-13, finance charges decreased $30 million or 45.2 per cent, mainly due to the repayment of $900 million fixed rate
note by the Company in December 2011.
Interest Income
Interest income was $12 million or 23.6 per cent higher, largely due to higher interest from the Company’s investment in bonds
and credit-linked notes.
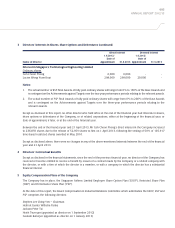
Surplus on Disposal of Aircraft, Spares and Spare Engines
The $73 million gain on disposal of aircraft, spares and spare engines arose mainly from the sale and leaseback of 14 Trent
800 engines and two A380-800 aircraft. Last year’s $4 million loss on disposal of aircraft, spares and spare engines was mainly
from loss on sale of one B747-400 aircraft, partially offset by gain on sale and leaseback of four B777-300 engines and one
A380-800 aircraft.
Other Non-operating Items
Other non-operating items pertained mainly to the impairment loss of $1,169 million recorded on the Company’s investment in
Virgin Atlantic Limited to write down its carrying value to a recoverable value of USD360 million ($447 million).
Fuel Productivity of Passenger Fleet
LTK/BBL
440
430
420
410
400
LTK/BBL
430
440
400
410
420
2008-09 2009-10 2010-11 2011-12 2012-13