Singapore Airlines 2013 Annual Report Download - page 176
Download and view the complete annual report
Please find page 176 of the 2013 Singapore Airlines annual report below. You can navigate through the pages in the report by either clicking on the pages listed below, or by using the keyword search tool below to find specific information within the annual report.-
 1
1 -
2
-
3
-
4
-
5
-
6
-
7
-
8
-
9
-
10
-
11
-
12
-
13
-
14
-
15
-
16
-
17
-
18
-
19
-
20
-
21
-
22
-
23
-
24
-
25
-
26
-
27
-
28
-
29
-
30
-
31
-
32
-
33
-
34
-
35
-
36
-
37
-
38
-
39
-
40
-
41
-
42
-
43
-
44
-
45
-
46
-
47
-
48
-
49
-
50
-
51
-
52
-
53
-
54
-
55
-
56
-
57
-
58
-
59
-
60
-
61
-
62
-
63
-
64
-
65
-
66
-
67
-
68
-
69
-
70
-
71
-
72
-
73
-
74
-
75
-
76
-
77
-
78
-
79
-
80
-
81
-
82
-
83
-
84
-
85
-
86
-
87
-
88
-
89
-
90
-
91
-
92
-
93
-
94
-
95
-
96
-
97
-
98
-
99
-
100
-
101
-
102
-
103
-
104
-
105
-
106
-
107
-
108
-
109
-
110
-
111
-
112
-
113
-
114
-
115
-
116
-
117
-
118
-
119
-
120
-
121
-
122
-
123
-
124
-
125
-
126
-
127
-
128
-
129
-
130
-
131
-
132
-
133
-
134
-
135
-
136
-
137
-
138
-
139
-
140
-
141
-
142
-
143
-
144
-
145
-
146
-
147
-
148
-
149
-
150
-
151
-
152
-
153
-
154
-
155
-
156
-
157
-
158
-
159
-
160
-
161
-
162
-
163
-
164
-
165
-
 166
166 -
 167
167 -
 168
168 -
 169
169 -
 170
170 -
 171
171 -
 172
172 -
 173
173 -
 174
174 -
 175
175 -
 176
176 -
 177
177 -
 178
178 -
 179
179 -
 180
180 -
 181
181 -
 182
182 -
 183
183 -
 184
184 -
 185
185 -
 186
186 -
187
-
188
-
189
-
190
-
191
-
192
-
193
-
194
-
195
-
196
-
197
-
198
-
199
-
200
-
201
-
202
-
203
-
204
-
205
-
206
-
207
-
208
-
209
-
210
 |
 |

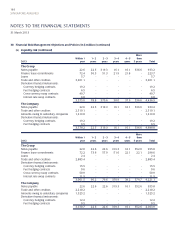
174
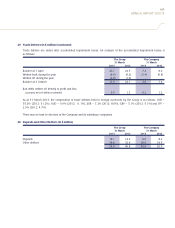
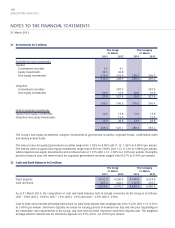
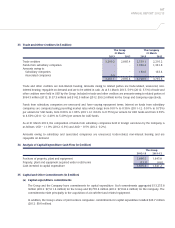
SINGAPORE AIRLINES
NOTES TO THE FINANCIAL STATEMENTS
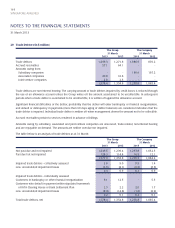
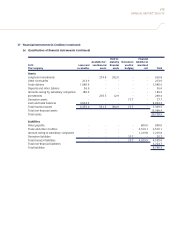
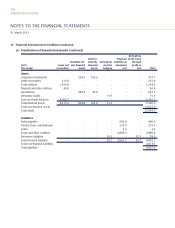
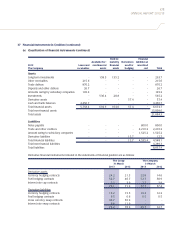
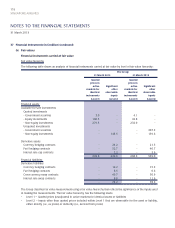
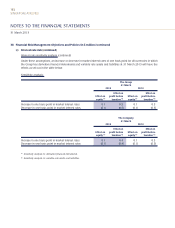
37 Financial Instruments (in $ million) (continued)
(a) Classification of financial instruments (continued)
Derivatives
Held-to- Financial at fair value
Available-for- maturity Derivatives liabilities at through
2012 Loans and sale financial financial used for amortised profit or
The Group receivables assets assets hedging cost loss Total
Assets
Long-term investments - 238.5 135.2 - - - 373.7
Other receivables 215.6 - - - - - 215.6
Trade debtors 1,354.8 - - - - - 1,354.8
Deposits and other debtors 46.8 - - - - - 46.8
Investments - 596.3 28.8 - - - 625.1
Derivative assets - - - 71.9 - - 71.9
Cash and bank balances 4,702.7 - - - - - 4,702.7
Total financial assets 6,319.9 834.8 164.0 71.9 - - 7,390.6
Total non-financial assets 14,652.4
Total assets 22,043.0
Liabilities
Notes payable - - - - 800.0 - 800.0
Finance lease commitments - - - - 275.4 - 275.4
Loans - - - - 2.4 - 2.4
Trade and other creditors - - - - 2,885.4 - 2,885.4
Derivative liabilities - - - 26.2 - 52.7 78.9
Total financial liabilities - - - 26.2 3,963.2 52.7 4,042.1
Total non-financial liabilities 4,813.5
Total liabilities 8,855.6
31 March 2013