Singapore Airlines 2013 Annual Report Download - page 71
Download and view the complete annual report
Please find page 71 of the 2013 Singapore Airlines annual report below. You can navigate through the pages in the report by either clicking on the pages listed below, or by using the keyword search tool below to find specific information within the annual report.-
 1
1 -
2
-
3
-
4
-
5
-
6
-
7
-
8
-
9
-
10
-
11
-
12
-
13
-
14
-
15
-
16
-
17
-
18
-
19
-
20
-
21
-
22
-
23
-
24
-
25
-
26
-
27
-
28
-
29
-
30
-
31
-
32
-
33
-
34
-
35
-
36
-
37
-
38
-
39
-
40
-
41
-
42
-
43
-
44
-
45
-
46
-
47
-
48
-
49
-
50
-
51
-
52
-
53
-
54
-
55
-
56
-
57
-
58
-
59
-
60
-
 61
61 -
 62
62 -
 63
63 -
 64
64 -
 65
65 -
 66
66 -
 67
67 -
 68
68 -
 69
69 -
 70
70 -
 71
71 -
 72
72 -
 73
73 -
 74
74 -
 75
75 -
 76
76 -
 77
77 -
 78
78 -
 79
79 -
 80
80 -
 81
81 -
82
-
83
-
84
-
85
-
86
-
87
-
88
-
89
-
90
-
91
-
92
-
93
-
94
-
95
-
96
-
97
-
98
-
99
-
100
-
101
-
102
-
103
-
104
-
105
-
106
-
107
-
108
-
109
-
110
-
111
-
112
-
113
-
114
-
115
-
116
-
117
-
118
-
119
-
120
-
121
-
122
-
123
-
124
-
125
-
126
-
127
-
128
-
129
-
130
-
131
-
132
-
133
-
134
-
135
-
136
-
137
-
138
-
139
-
140
-
141
-
142
-
143
-
144
-
145
-
146
-
147
-
148
-
149
-
150
-
151
-
152
-
153
-
154
-
155
-
156
-
157
-
158
-
159
-
160
-
161
-
162
-
163
-
164
-
165
-
166
-
167
-
168
-
169
-
170
-
171
-
172
-
173
-
174
-
175
-
176
-
177
-
178
-
179
-
180
-
181
-
182
-
183
-
184
-
185
-
186
-
187
-
188
-
189
-
190
-
191
-
192
-
193
-
194
-
195
-
196
-
197
-
198
-
199
-
200
-
201
-
202
-
203
-
204
-
205
-
206
-
207
-
208
-
209
-
210
 |
 |

069
ANNUAL REPORT 2012/13
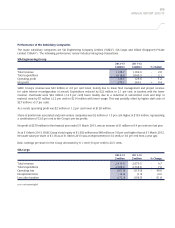
Performance of the Group (continued)
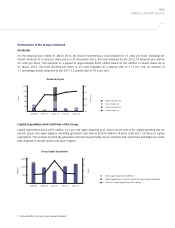
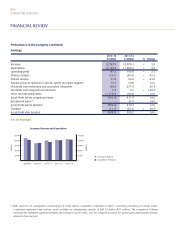
Dividends
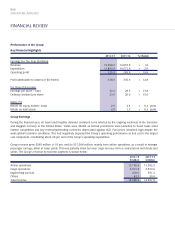
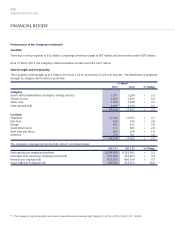
For the financial year ended 31 March 2013, the Board recommends a final dividend of 17 cents per share. Including the
interim dividend of 6 cents per share paid on 26 November 2012, the total dividend for the 2012-13 financial year will be
23 cents per share. This amounts to a payout of approximately $270 million based on the number of issued shares as at
31 March 2013. The total dividend per share of 23 cents translates to a payout ratio of 71.3 per cent, an increase of
1.1 percentage points compared to the 2011-12 payout ratio of 70.2 per cent.
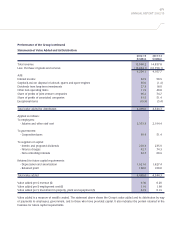
Capital Expenditure and Cash Flow of the Group
Capital expenditure was $1,875 million, 14.3 per cent higher than last year. About 98 per cent of the capital spending was on
aircraft, spares and spare engines. Internally generated cash flow of $2,859 million (+4.8 per cent) was 1.52 times of capital
expenditure. The increase in internally generated cash flow was primarily due to cash flow from operations and higher proceeds
from disposal of aircraft, spares and spare engines.
Dividend Payout
Cents
150
120
90
60
30
0
Per Cent
50
60
70
80
40
2008-09 2009-10 2010-11 2011-12 2012-13
R2
Group Capital Expenditure
$ Million
2,400
1,600
800
0
Times
1
2
3
4
0
2008-09 2009-10 2010-11 2011-12 2012-13
R2 Excludes 80.0 cents per share special dividend.