Singapore Airlines 2013 Annual Report Download - page 165
Download and view the complete annual report
Please find page 165 of the 2013 Singapore Airlines annual report below. You can navigate through the pages in the report by either clicking on the pages listed below, or by using the keyword search tool below to find specific information within the annual report.-
 1
1 -
2
-
3
-
4
-
5
-
6
-
7
-
8
-
9
-
10
-
11
-
12
-
13
-
14
-
15
-
16
-
17
-
18
-
19
-
20
-
21
-
22
-
23
-
24
-
25
-
26
-
27
-
28
-
29
-
30
-
31
-
32
-
33
-
34
-
35
-
36
-
37
-
38
-
39
-
40
-
41
-
42
-
43
-
44
-
45
-
46
-
47
-
48
-
49
-
50
-
51
-
52
-
53
-
54
-
55
-
56
-
57
-
58
-
59
-
60
-
61
-
62
-
63
-
64
-
65
-
66
-
67
-
68
-
69
-
70
-
71
-
72
-
73
-
74
-
75
-
76
-
77
-
78
-
79
-
80
-
81
-
82
-
83
-
84
-
85
-
86
-
87
-
88
-
89
-
90
-
91
-
92
-
93
-
94
-
95
-
96
-
97
-
98
-
99
-
100
-
101
-
102
-
103
-
104
-
105
-
106
-
107
-
108
-
109
-
110
-
111
-
112
-
113
-
114
-
115
-
116
-
117
-
118
-
119
-
120
-
121
-
122
-
123
-
124
-
125
-
126
-
127
-
128
-
129
-
130
-
131
-
132
-
133
-
134
-
135
-
136
-
137
-
138
-
139
-
140
-
141
-
142
-
143
-
144
-
145
-
146
-
147
-
148
-
149
-
150
-
151
-
152
-
153
-
154
-
 155
155 -
 156
156 -
 157
157 -
 158
158 -
 159
159 -
 160
160 -
 161
161 -
 162
162 -
 163
163 -
 164
164 -
 165
165 -
 166
166 -
 167
167 -
 168
168 -
 169
169 -
 170
170 -
 171
171 -
 172
172 -
 173
173 -
 174
174 -
 175
175 -
176
-
177
-
178
-
179
-
180
-
181
-
182
-
183
-
184
-
185
-
186
-
187
-
188
-
189
-
190
-
191
-
192
-
193
-
194
-
195
-
196
-
197
-
198
-
199
-
200
-
201
-
202
-
203
-
204
-
205
-
206
-
207
-
208
-
209
-
210
 |
 |

163
ANNUAL REPORT 2012/13
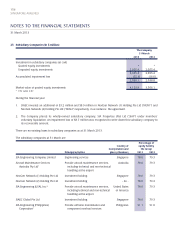
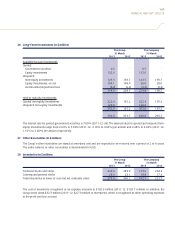
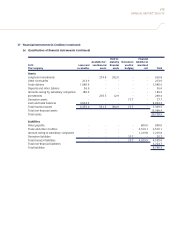
26 Long-Term Investments (in $ million)
The Group The Company
31 March 31 March
2013 2012 2013 2012
Available-for-sale investments
Quoted
Government securities 0.5 - 0.5 -
Equity investments 132.0 - 132.0 -
Unquoted
Non-equity investments 123.5 139.7 123.5 139.7
Equity investments, at cost 108.1 108.0 28.0 28.0
Accumulated impairment loss (9.2) (9.2) (9.2) (9.2)
354.9 238.5 274.8 158.5
Held-to-maturity investments
Quoted non-equity investments 222.4 135.2 222.4 135.2
Unquoted non-equity investments 129.6 - 129.6 -
352.0 135.2 352.0 135.2
706.9 373.7 626.8 293.7
The interest rate for quoted government securities is 7.00% (2011-12: nil). The interest rates for quoted and unquoted non-
equity investments range from 2.63% to 5.60% (2011-12: 3.10% to 4.65%) per annum and 2.28% to 4.02% (2011-12:
1.15% to 3.20%) per annum respectively.
27 Other Receivables (in $ million)
The Group’s other receivables are stated at amortised cost and are expected to be received over a period of 2 to 4 years.
The entire balance of other receivables is denominated in USD.
28 Inventories (in $ million)
The Group The Company
31 March 31 March
2013 2012 2013 2012
Technical stocks and stores 248.5 283.0 173.9 204.4
Catering and general stocks 26.4 23.1 18.8 17.3
Total inventories at lower of cost and net realisable value 274.9 306.1 192.7 221.7
The cost of inventories recognised as an expense amounts to $102.9 million (2011-12: $102.7 million). In addition, the
Group wrote down $32.3 million (2011-12: $27.3 million) of inventories, which is recognised as other operating expenses
in the profit and loss account.