Singapore Airlines 2013 Annual Report Download - page 168
Download and view the complete annual report
Please find page 168 of the 2013 Singapore Airlines annual report below. You can navigate through the pages in the report by either clicking on the pages listed below, or by using the keyword search tool below to find specific information within the annual report.-
 1
1 -
2
-
3
-
4
-
5
-
6
-
7
-
8
-
9
-
10
-
11
-
12
-
13
-
14
-
15
-
16
-
17
-
18
-
19
-
20
-
21
-
22
-
23
-
24
-
25
-
26
-
27
-
28
-
29
-
30
-
31
-
32
-
33
-
34
-
35
-
36
-
37
-
38
-
39
-
40
-
41
-
42
-
43
-
44
-
45
-
46
-
47
-
48
-
49
-
50
-
51
-
52
-
53
-
54
-
55
-
56
-
57
-
58
-
59
-
60
-
61
-
62
-
63
-
64
-
65
-
66
-
67
-
68
-
69
-
70
-
71
-
72
-
73
-
74
-
75
-
76
-
77
-
78
-
79
-
80
-
81
-
82
-
83
-
84
-
85
-
86
-
87
-
88
-
89
-
90
-
91
-
92
-
93
-
94
-
95
-
96
-
97
-
98
-
99
-
100
-
101
-
102
-
103
-
104
-
105
-
106
-
107
-
108
-
109
-
110
-
111
-
112
-
113
-
114
-
115
-
116
-
117
-
118
-
119
-
120
-
121
-
122
-
123
-
124
-
125
-
126
-
127
-
128
-
129
-
130
-
131
-
132
-
133
-
134
-
135
-
136
-
137
-
138
-
139
-
140
-
141
-
142
-
143
-
144
-
145
-
146
-
147
-
148
-
149
-
150
-
151
-
152
-
153
-
154
-
155
-
156
-
157
-
 158
158 -
 159
159 -
 160
160 -
 161
161 -
 162
162 -
 163
163 -
 164
164 -
 165
165 -
 166
166 -
 167
167 -
 168
168 -
 169
169 -
 170
170 -
 171
171 -
 172
172 -
 173
173 -
 174
174 -
 175
175 -
 176
176 -
 177
177 -
 178
178 -
179
-
180
-
181
-
182
-
183
-
184
-
185
-
186
-
187
-
188
-
189
-
190
-
191
-
192
-
193
-
194
-
195
-
196
-
197
-
198
-
199
-
200
-
201
-
202
-
203
-
204
-
205
-
206
-
207
-
208
-
209
-
210
 |
 |

166
SINGAPORE AIRLINES
NOTES TO THE FINANCIAL STATEMENTS
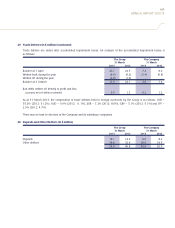
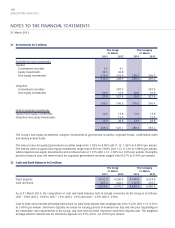
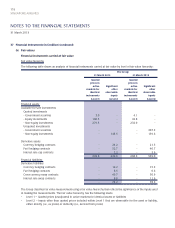
31 Investments (in $ million)
The Group The Company
31 March 31 March
2013 2012 2013 2012
Available-for-sale investments
Quoted
Government securities 2.5 4.1 - -
Equity investments 34.5 32.8 - -
Non-equity investments 279.5 232.0 256.5 209.0
316.5 268.9 256.5 209.0
Unquoted
Government securities - 307.5 - 307.5
Non-equity investments 20.0 19.9 20.0 19.9
20.0 327.4 20.0 327.4
336.5 596.3 276.5 536.4
Held-to-maturity investments
Quoted non-equity investments 12.9 13.8 12.9 13.8
Unquoted non-equity investments - 15.0 - 15.0
12.9 28.8 12.9 28.8
349.4 625.1 289.4 565.2
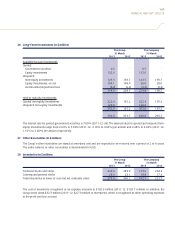
The Group’s non-equity investments comprise investments in government securities, corporate bonds, credit-linked notes
and money market funds.
The interest rates for quoted government securities range from 1.63% to 4.00% (2011-12: 1.63% to 4.00%) per annum.
The interest rates for quoted non-equity investments range from 0.05% to 5.88% (2011-12: 0.12% to 5.88%) per annum,
while unquoted non-equity investments yield an interest rate of 1.15% (2011-12: 1.00% to 1.06%) per annum. During the
previous financial year, the interest rates for unquoted government securities ranged from 0.27% to 0.39% per annum.
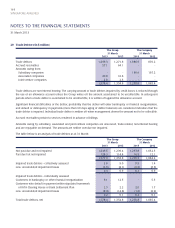
32 Cash and Bank Balances (in $ million)
The Group The Company
31 March 31 March
2013 2012 2013 2012
Fixed deposits 4,692.4 4,260.6 4,666.8 4,234.0
Cash and bank 367.2 442.1 167.5 216.7
5,059.6 4,702.7 4,834.3 4,450.7
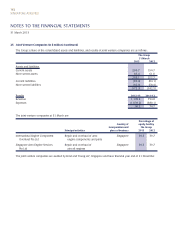
As at 31 March 2013, the composition of cash and bank balances held in foreign currencies by the Group is as follows:
USD – 6.8% (2012: 10.8%), EUR – 1.9% (2012: 1.6%) and AUD – 2.8% (2012: 0.8%).
Cash at bank earns interest at floating rates based on daily bank deposit rates ranging from nil to 3.22% (2011-12: 0.01%
to 5.40%) per annum. Short-term deposits are made for varying periods of between one day and one year depending on
the immediate cash requirements of the Group, and earn interest at the respective short-term deposit rates. The weighted
average effective interest rate for short-term deposits is 0.57% (2011-12: 0.55%) per annum.
31 March 2013