Singapore Airlines 2013 Annual Report Download - page 194
Download and view the complete annual report
Please find page 194 of the 2013 Singapore Airlines annual report below. You can navigate through the pages in the report by either clicking on the pages listed below, or by using the keyword search tool below to find specific information within the annual report.-
 1
1 -
2
-
3
-
4
-
5
-
6
-
7
-
8
-
9
-
10
-
11
-
12
-
13
-
14
-
15
-
16
-
17
-
18
-
19
-
20
-
21
-
22
-
23
-
24
-
25
-
26
-
27
-
28
-
29
-
30
-
31
-
32
-
33
-
34
-
35
-
36
-
37
-
38
-
39
-
40
-
41
-
42
-
43
-
44
-
45
-
46
-
47
-
48
-
49
-
50
-
51
-
52
-
53
-
54
-
55
-
56
-
57
-
58
-
59
-
60
-
61
-
62
-
63
-
64
-
65
-
66
-
67
-
68
-
69
-
70
-
71
-
72
-
73
-
74
-
75
-
76
-
77
-
78
-
79
-
80
-
81
-
82
-
83
-
84
-
85
-
86
-
87
-
88
-
89
-
90
-
91
-
92
-
93
-
94
-
95
-
96
-
97
-
98
-
99
-
100
-
101
-
102
-
103
-
104
-
105
-
106
-
107
-
108
-
109
-
110
-
111
-
112
-
113
-
114
-
115
-
116
-
117
-
118
-
119
-
120
-
121
-
122
-
123
-
124
-
125
-
126
-
127
-
128
-
129
-
130
-
131
-
132
-
133
-
134
-
135
-
136
-
137
-
138
-
139
-
140
-
141
-
142
-
143
-
144
-
145
-
146
-
147
-
148
-
149
-
150
-
151
-
152
-
153
-
154
-
155
-
156
-
157
-
158
-
159
-
160
-
161
-
162
-
163
-
164
-
165
-
166
-
167
-
168
-
169
-
170
-
171
-
172
-
173
-
174
-
175
-
176
-
177
-
178
-
179
-
180
-
181
-
182
-
183
-
 184
184 -
 185
185 -
 186
186 -
 187
187 -
 188
188 -
 189
189 -
 190
190 -
 191
191 -
 192
192 -
 193
193 -
 194
194 -
 195
195 -
 196
196 -
 197
197 -
 198
198 -
 199
199 -
 200
200 -
 201
201 -
 202
202 -
 203
203 -
 204
204 -
205
-
206
-
207
-
208
-
209
-
210
 |
 |

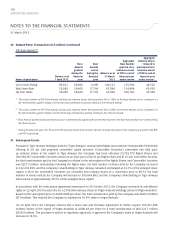
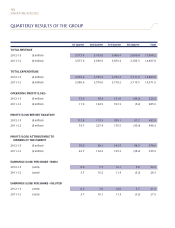
192
SINGAPORE AIRLINES
1st Quarter 2nd Quarter 3rd Quarter 4th Quarter Total
TOTAL REVENUE
2012-13 ($ million) 3,777.4 3,793.6 3,860.4 3,666.8 15,098.2
2011-12 ($ million) 3,577.6 3,699.5 3,875.4 3,705.3 14,857.8
TOTAL EXPENDITURE
2012-13 ($ million) 3,705.4 3,723.2 3,729.4 3,711.0 14,869.0
2011-12 ($ million) 3,566.6 3,576.6 3,718.2 3,710.5 14,571.9
OPERATING PROFIT/(LOSS)
2012-13 ($ million) 72.0 70.4 131.0 (44.2) 229.2
2011-12 ($ million) 11.0 122.9 157.2 (5.2) 285.9
PROFIT/(LOSS) BEFORE TAXATION
2012-13 ($ million) 115.8 115.9 189.1 61.2 482.0
2011-12 ($ million) 74.7 227.4 176.5 (30.4) 448.2
PROFIT/(LOSS) ATTRIBUTABLE TO
OWNERS OF THE PARENT
2012-13 ($ million) 78.0 90.1 142.5 68.3 378.9
2011-12 ($ million) 44.7 194.2 135.2 (38.2) 335.9
EARNINGS/(LOSS) PER SHARE - BASIC
2012-13 (cents) 6.6 7.7 12.1 5.8 32.2
2011-12 (cents) 3.7 16.2 11.4 (3.2) 28.3
EARNINGS/(LOSS) PER SHARE - DILUTED
2012-13 (cents) 6.6 7.6 12.0 5.7 31.9
2011-12 (cents) 3.7 16.1 11.3 (3.2) 27.9
QUARTERLY RESULTS OF THE GROUP