Singapore Airlines 2013 Annual Report Download - page 195
Download and view the complete annual report
Please find page 195 of the 2013 Singapore Airlines annual report below. You can navigate through the pages in the report by either clicking on the pages listed below, or by using the keyword search tool below to find specific information within the annual report.-
 1
1 -
2
-
3
-
4
-
5
-
6
-
7
-
8
-
9
-
10
-
11
-
12
-
13
-
14
-
15
-
16
-
17
-
18
-
19
-
20
-
21
-
22
-
23
-
24
-
25
-
26
-
27
-
28
-
29
-
30
-
31
-
32
-
33
-
34
-
35
-
36
-
37
-
38
-
39
-
40
-
41
-
42
-
43
-
44
-
45
-
46
-
47
-
48
-
49
-
50
-
51
-
52
-
53
-
54
-
55
-
56
-
57
-
58
-
59
-
60
-
61
-
62
-
63
-
64
-
65
-
66
-
67
-
68
-
69
-
70
-
71
-
72
-
73
-
74
-
75
-
76
-
77
-
78
-
79
-
80
-
81
-
82
-
83
-
84
-
85
-
86
-
87
-
88
-
89
-
90
-
91
-
92
-
93
-
94
-
95
-
96
-
97
-
98
-
99
-
100
-
101
-
102
-
103
-
104
-
105
-
106
-
107
-
108
-
109
-
110
-
111
-
112
-
113
-
114
-
115
-
116
-
117
-
118
-
119
-
120
-
121
-
122
-
123
-
124
-
125
-
126
-
127
-
128
-
129
-
130
-
131
-
132
-
133
-
134
-
135
-
136
-
137
-
138
-
139
-
140
-
141
-
142
-
143
-
144
-
145
-
146
-
147
-
148
-
149
-
150
-
151
-
152
-
153
-
154
-
155
-
156
-
157
-
158
-
159
-
160
-
161
-
162
-
163
-
164
-
165
-
166
-
167
-
168
-
169
-
170
-
171
-
172
-
173
-
174
-
175
-
176
-
177
-
178
-
179
-
180
-
181
-
182
-
183
-
184
-
 185
185 -
 186
186 -
 187
187 -
 188
188 -
 189
189 -
 190
190 -
 191
191 -
 192
192 -
 193
193 -
 194
194 -
 195
195 -
 196
196 -
 197
197 -
 198
198 -
 199
199 -
 200
200 -
 201
201 -
 202
202 -
 203
203 -
 204
204 -
 205
205 -
206
-
207
-
208
-
209
-
210
 |
 |

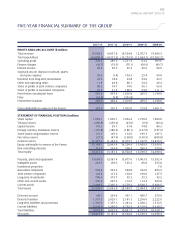
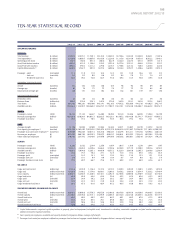
193
ANNUAL REPORT 2012/13
2012-13 2011-12 2010-11 2009-10 2008-09
PROFIT AND LOSS ACCOUNT ($ million)
Total revenue 15,098.2 14,857.8 14,524.8 12,707.3 15,996.3
Total expenditure (14,869.0) (14,571.9) (13,253.5) (12,644.1) (15,092.7)
Operating profit 229.2 285.9 1,271.3 63.2 903.6
Finance charges (42.7) (74.3) (70.1) (68.9) (89.7)
Interest income 62.5 50.5 37.3 49.5 96.0
Surplus/(Loss) on disposal of aircraft, spares
and spare engines 56.0 (1.4) 103.3 25.4 60.6
Dividend from long-term investments 27.3 18.0 23.8 33.0 23.7
Other non-operating items 11.9 48.8 80.1 34.2 29.4
Share of profits of joint venture companies 96.2 74.7 74.6 56.1 63.9
Share of profits of associated companies 61.5 51.4 100.5 93.0 111.1
Profit before exceptional items 501.9 453.6 1,620.8 285.5 1,198.6
Fines (19.9) (5.4) (201.8) - -
Profit before taxation 482.0 448.2 1,419.0 285.5 1,198.6
Profit attributable to owners of the Parent 378.9 335.9 1,092.0 215.8 1,061.5
STATEMENT OF FINANCIAL POSITION ($ million)
Share capital 1,856.1 1,856.1 1,832.4 1,750.6 1,684.8
Treasury shares (269.8) (258.4) (43.0) (0.9) (44.4)
Capital reserve 110.3 99.1 91.8 74.8 86.3
Foreign currency translation reserve (191.8) (186.3) (186.1) (137.0) (137.9)
Share-based compensation reserve 151.7 165.9 172.6 185.3 187.3
Fair value reserve (27.1) (47.6) (138.0) (140.9) (660.8)
General reserve 11,475.3 11,264.6 12,474.7 11,737.0 12,815.3
Equity attributable to owners of the Parent 13,104.7 12,893.4 14,204.4 13,468.9 13,930.6
Non-controlling interests 312.6 294.0 298.4 280.4 559.8
Total equity 13,417.3 13,187.4 14,502.8 13,749.3 14,490.4
Property, plant and equipment 13,098.0 13,381.4 13,877.6 15,063.9 15,992.4
Intangible assets 218.5 158.3 125.2 80.8 553.0
Investment properties - - - - 7.0
Associated companies 554.4 543.2 504.8 532.6 855.3
Joint venture companies 120.8 113.2 102.8 108.6 127.5
Long-term investments 706.9 373.7 35.3 35.3 43.2
Other non-current assets 230.0 267.3 119.6 114.4 403.6
Current assets 7,499.5 7,205.9 9,779.2 6,548.7 6,836.5
Total assets 22,428.1 22,043.0 24,544.5 22,484.3 24,818.5
Deferred account 146.7 224.4 347.1 480.7 673.9
Deferred taxation 1,951.3 2,029.1 2,181.1 2,296.6 2,222.0
Long-term liabilities and provisions 1,365.8 1,337.1 1,281.2 1,438.1 1,513.5
Current liabilities 5,547.0 5,265.0 6,232.3 4,519.6 5,918.7
Total liabilities 9,010.8 8,855.6 10,041.7 8,735.0 10,328.1
Net assets 13,417.3 13,187.4 14,502.8 13,749.3 14,490.4
FIVE-YEAR FINANCIAL SUMMARY OF THE GROUP