Singapore Airlines 2013 Annual Report Download - page 202
Download and view the complete annual report
Please find page 202 of the 2013 Singapore Airlines annual report below. You can navigate through the pages in the report by either clicking on the pages listed below, or by using the keyword search tool below to find specific information within the annual report.-
 1
1 -
2
-
3
-
4
-
5
-
6
-
7
-
8
-
9
-
10
-
11
-
12
-
13
-
14
-
15
-
16
-
17
-
18
-
19
-
20
-
21
-
22
-
23
-
24
-
25
-
26
-
27
-
28
-
29
-
30
-
31
-
32
-
33
-
34
-
35
-
36
-
37
-
38
-
39
-
40
-
41
-
42
-
43
-
44
-
45
-
46
-
47
-
48
-
49
-
50
-
51
-
52
-
53
-
54
-
55
-
56
-
57
-
58
-
59
-
60
-
61
-
62
-
63
-
64
-
65
-
66
-
67
-
68
-
69
-
70
-
71
-
72
-
73
-
74
-
75
-
76
-
77
-
78
-
79
-
80
-
81
-
82
-
83
-
84
-
85
-
86
-
87
-
88
-
89
-
90
-
91
-
92
-
93
-
94
-
95
-
96
-
97
-
98
-
99
-
100
-
101
-
102
-
103
-
104
-
105
-
106
-
107
-
108
-
109
-
110
-
111
-
112
-
113
-
114
-
115
-
116
-
117
-
118
-
119
-
120
-
121
-
122
-
123
-
124
-
125
-
126
-
127
-
128
-
129
-
130
-
131
-
132
-
133
-
134
-
135
-
136
-
137
-
138
-
139
-
140
-
141
-
142
-
143
-
144
-
145
-
146
-
147
-
148
-
149
-
150
-
151
-
152
-
153
-
154
-
155
-
156
-
157
-
158
-
159
-
160
-
161
-
162
-
163
-
164
-
165
-
166
-
167
-
168
-
169
-
170
-
171
-
172
-
173
-
174
-
175
-
176
-
177
-
178
-
179
-
180
-
181
-
182
-
183
-
184
-
185
-
186
-
187
-
188
-
189
-
190
-
191
-
 192
192 -
 193
193 -
 194
194 -
 195
195 -
 196
196 -
 197
197 -
 198
198 -
 199
199 -
 200
200 -
 201
201 -
 202
202 -
 203
203 -
 204
204 -
 205
205 -
 206
206 -
 207
207 -
 208
208 -
 209
209 -
 210
210
 |
 |

200
SINGAPORE AIRLINES
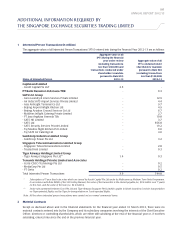
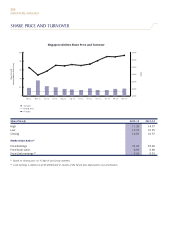
SHARE PRICE AND TURNOVER
Share Price ($) 2012-13 2011-12
High 11.35 14.77
Low 10.10 10.05
Closing 10.87 10.77
Market Value Ratios R1
Price/Earnings 33.76 38.06
Price/Book value 0.97 0.98
Price/Cash earnings R2 6.39 6.53
R1 Based on closing price on 31 March and Group numbers.
R2 Cash earnings is defined as profit attributable to owners of the Parent plus depreciation and amortisation.
Turnover
Closing Price
ST Index
Share Price ($)
Volume (Million Stock Units)
Singapore Airlines Share Price and Turnover
Apr 12 Jun 12 Aug 12 Oct 12 Dec 12 Feb 13May 12 Jul 12 Sep 12 Nov 12 Jan 13 Mar 13
Index
2,600
2,800
3,000
3,200
3,400
2,400
2,200
100
60
40
80
20
0