Singapore Airlines 2013 Annual Report Download - page 167
Download and view the complete annual report
Please find page 167 of the 2013 Singapore Airlines annual report below. You can navigate through the pages in the report by either clicking on the pages listed below, or by using the keyword search tool below to find specific information within the annual report.-
 1
1 -
2
-
3
-
4
-
5
-
6
-
7
-
8
-
9
-
10
-
11
-
12
-
13
-
14
-
15
-
16
-
17
-
18
-
19
-
20
-
21
-
22
-
23
-
24
-
25
-
26
-
27
-
28
-
29
-
30
-
31
-
32
-
33
-
34
-
35
-
36
-
37
-
38
-
39
-
40
-
41
-
42
-
43
-
44
-
45
-
46
-
47
-
48
-
49
-
50
-
51
-
52
-
53
-
54
-
55
-
56
-
57
-
58
-
59
-
60
-
61
-
62
-
63
-
64
-
65
-
66
-
67
-
68
-
69
-
70
-
71
-
72
-
73
-
74
-
75
-
76
-
77
-
78
-
79
-
80
-
81
-
82
-
83
-
84
-
85
-
86
-
87
-
88
-
89
-
90
-
91
-
92
-
93
-
94
-
95
-
96
-
97
-
98
-
99
-
100
-
101
-
102
-
103
-
104
-
105
-
106
-
107
-
108
-
109
-
110
-
111
-
112
-
113
-
114
-
115
-
116
-
117
-
118
-
119
-
120
-
121
-
122
-
123
-
124
-
125
-
126
-
127
-
128
-
129
-
130
-
131
-
132
-
133
-
134
-
135
-
136
-
137
-
138
-
139
-
140
-
141
-
142
-
143
-
144
-
145
-
146
-
147
-
148
-
149
-
150
-
151
-
152
-
153
-
154
-
155
-
156
-
 157
157 -
 158
158 -
 159
159 -
 160
160 -
 161
161 -
 162
162 -
 163
163 -
 164
164 -
 165
165 -
 166
166 -
 167
167 -
 168
168 -
 169
169 -
 170
170 -
 171
171 -
 172
172 -
 173
173 -
 174
174 -
 175
175 -
 176
176 -
 177
177 -
178
-
179
-
180
-
181
-
182
-
183
-
184
-
185
-
186
-
187
-
188
-
189
-
190
-
191
-
192
-
193
-
194
-
195
-
196
-
197
-
198
-
199
-
200
-
201
-
202
-
203
-
204
-
205
-
206
-
207
-
208
-
209
-
210
 |
 |

165
ANNUAL REPORT 2012/13
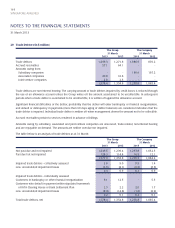
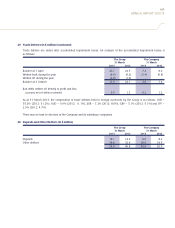
29 Trade Debtors (in $ million) (continued)
Trade debtors are stated after accumulated impairment losses. An analysis of the accumulated impairment losses is
as follows:
The Group The Company
31 March 31 March
2013 2012 2013 2012
Balance at 1 April 22.7 24.5 7.4 8.2
Written back during the year (8.8) (0.2) (5.4) (0.8)
Written off during the year (2.0) (1.6) - -
Balance at 31 March 11.9 22.7 2.0 7.4
Bad debts written off directly to profit and loss
account, net of debts recovered 0.5 1.3 0.2 1.2
As at 31 March 2013, the composition of trade debtors held in foreign currencies by the Group is as follows: USD –
35.2% (2012: 31.2%), AUD – 9.9% (2012: 11.1%), EUR – 7.2% (2012: 8.0%), GBP – 5.1% (2012: 5.1%) and JPY –
2.9% (2012: 4.7%).
There was no loan to directors of the Company and its subsidiary companies.
30 Deposits and Other Debtors (in $ million)
The Group The Company
31 March 31 March
2013 2012 2013 2012
Deposits 16.1 14.2 8.6 8.2
Other debtors 38.8 32.6 28.0 18.5
54.9 46.8 36.6 26.7