Singapore Airlines 2013 Annual Report Download - page 174
Download and view the complete annual report
Please find page 174 of the 2013 Singapore Airlines annual report below. You can navigate through the pages in the report by either clicking on the pages listed below, or by using the keyword search tool below to find specific information within the annual report.-
 1
1 -
2
-
3
-
4
-
5
-
6
-
7
-
8
-
9
-
10
-
11
-
12
-
13
-
14
-
15
-
16
-
17
-
18
-
19
-
20
-
21
-
22
-
23
-
24
-
25
-
26
-
27
-
28
-
29
-
30
-
31
-
32
-
33
-
34
-
35
-
36
-
37
-
38
-
39
-
40
-
41
-
42
-
43
-
44
-
45
-
46
-
47
-
48
-
49
-
50
-
51
-
52
-
53
-
54
-
55
-
56
-
57
-
58
-
59
-
60
-
61
-
62
-
63
-
64
-
65
-
66
-
67
-
68
-
69
-
70
-
71
-
72
-
73
-
74
-
75
-
76
-
77
-
78
-
79
-
80
-
81
-
82
-
83
-
84
-
85
-
86
-
87
-
88
-
89
-
90
-
91
-
92
-
93
-
94
-
95
-
96
-
97
-
98
-
99
-
100
-
101
-
102
-
103
-
104
-
105
-
106
-
107
-
108
-
109
-
110
-
111
-
112
-
113
-
114
-
115
-
116
-
117
-
118
-
119
-
120
-
121
-
122
-
123
-
124
-
125
-
126
-
127
-
128
-
129
-
130
-
131
-
132
-
133
-
134
-
135
-
136
-
137
-
138
-
139
-
140
-
141
-
142
-
143
-
144
-
145
-
146
-
147
-
148
-
149
-
150
-
151
-
152
-
153
-
154
-
155
-
156
-
157
-
158
-
159
-
160
-
161
-
162
-
163
-
 164
164 -
 165
165 -
 166
166 -
 167
167 -
 168
168 -
 169
169 -
 170
170 -
 171
171 -
 172
172 -
 173
173 -
 174
174 -
 175
175 -
 176
176 -
 177
177 -
 178
178 -
 179
179 -
 180
180 -
 181
181 -
 182
182 -
 183
183 -
 184
184 -
185
-
186
-
187
-
188
-
189
-
190
-
191
-
192
-
193
-
194
-
195
-
196
-
197
-
198
-
199
-
200
-
201
-
202
-
203
-
204
-
205
-
206
-
207
-
208
-
209
-
210
 |
 |

172
SINGAPORE AIRLINES
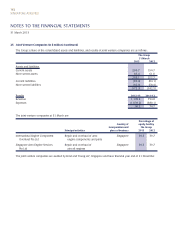
NOTES TO THE FINANCIAL STATEMENTS
36 Contingent Liabilities (in $ million) (continued)
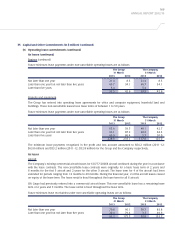
(d) Australian Travel Agents’ Representative Actions
A former Australian travel agent, Leonie’s Travel Pty Limited, filed a representative action in the Federal Court of
Australia (New South Wales District Registry) on 15 December 2006 against 6 airlines, namely Qantas Airways Limited,
British Airways plc, Air New Zealand Limited, Malaysian Airline System Berhad, Cathay Pacific Airways Limited (“CX”)
and Singapore Airlines Limited, in a claim on behalf of Australian travel agents for alleged non-payment of commissions
on fuel surcharges applied to passenger tickets issued in Australia from May 2004 onwards (the “Leonie’s Case”).
In May 2007, the applicant’s solicitors filed a fresh similar representative application on behalf of Paxtours International
Travel Pty Ltd, another Australian travel agent, against CX and the Company, as Leonie’s Travel did not issue fares
against CX or the Company (the “Paxtours Case”).
On 19 August 2011, the Leonie’s Case was discontinued against the Company.
Following discussion with Paxtours’ solicitors, the parties have agreed on a settlement mechanism, which has been
approved by the court. The settlement amount paid by the Company was not material and the case is now concluded.
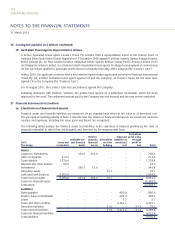
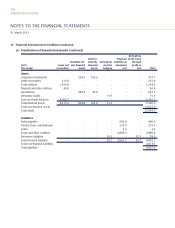
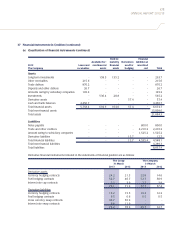
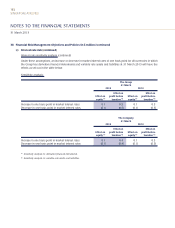
37 Financial Instruments (in $ million)
(a) Classification of financial instruments
Financial assets and financial liabilities are measured on an ongoing basis either at fair value or at amortised cost.
The principal accounting policies in Note 2 describe how the classes of financial instruments are measured, and how
revenue and expenses, including fair value gains and losses, are recognised.
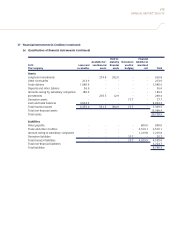
The following tables analyse the financial assets and liabilities in the statement of financial position by the class of
financial instrument to which they are assigned, and therefore by the measurement basis:
Derivatives
Held-to- Financial at fair value
Available-for- maturity Derivatives liabilities at through
2013 Loans and sale financial financial used for amortised profit or
The Group receivables assets assets hedging cost loss Total
Assets
Long-term investments - 354.9 352.0 - - - 706.9
Other receivables 213.9 - - - - - 213.9
Trade debtors 1,578.4 - - - - - 1,578.4
Deposits and other debtors 54.9 - - - - - 54.9
Investments - 336.5 12.9 - - - 349.4
Derivative assets - - - 79.1 - - 79.1
Cash and bank balances 5,059.6 - - - - - 5,059.6
Total financial assets 6,906.8 691.4 364.9 79.1 - - 8,042.2
Total non-financial assets 14,385.9
Total assets 22,428.1
Liabilities
Notes payable - - - - 800.0 - 800.0
Finance lease commitments - - - - 208.4 - 208.4
Loans - - - - 5.7 - 5.7
Trade and other creditors - - - - 3,201.1 - 3,201.1
Derivative liabilities - - - 31.9 - 41.3 73.2
Total financial liabilities - - - 31.9 4,215.2 41.3 4,288.4
Total non-financial liabilities 4,722.4
Total liabilities 9,010.8
31 March 2013