Singapore Airlines 2013 Annual Report Download - page 75
Download and view the complete annual report
Please find page 75 of the 2013 Singapore Airlines annual report below. You can navigate through the pages in the report by either clicking on the pages listed below, or by using the keyword search tool below to find specific information within the annual report.-
 1
1 -
2
-
3
-
4
-
5
-
6
-
7
-
8
-
9
-
10
-
11
-
12
-
13
-
14
-
15
-
16
-
17
-
18
-
19
-
20
-
21
-
22
-
23
-
24
-
25
-
26
-
27
-
28
-
29
-
30
-
31
-
32
-
33
-
34
-
35
-
36
-
37
-
38
-
39
-
40
-
41
-
42
-
43
-
44
-
45
-
46
-
47
-
48
-
49
-
50
-
51
-
52
-
53
-
54
-
55
-
56
-
57
-
58
-
59
-
60
-
61
-
62
-
63
-
64
-
 65
65 -
 66
66 -
 67
67 -
 68
68 -
 69
69 -
 70
70 -
 71
71 -
 72
72 -
 73
73 -
 74
74 -
 75
75 -
 76
76 -
 77
77 -
 78
78 -
 79
79 -
 80
80 -
 81
81 -
 82
82 -
 83
83 -
 84
84 -
 85
85 -
86
-
87
-
88
-
89
-
90
-
91
-
92
-
93
-
94
-
95
-
96
-
97
-
98
-
99
-
100
-
101
-
102
-
103
-
104
-
105
-
106
-
107
-
108
-
109
-
110
-
111
-
112
-
113
-
114
-
115
-
116
-
117
-
118
-
119
-
120
-
121
-
122
-
123
-
124
-
125
-
126
-
127
-
128
-
129
-
130
-
131
-
132
-
133
-
134
-
135
-
136
-
137
-
138
-
139
-
140
-
141
-
142
-
143
-
144
-
145
-
146
-
147
-
148
-
149
-
150
-
151
-
152
-
153
-
154
-
155
-
156
-
157
-
158
-
159
-
160
-
161
-
162
-
163
-
164
-
165
-
166
-
167
-
168
-
169
-
170
-
171
-
172
-
173
-
174
-
175
-
176
-
177
-
178
-
179
-
180
-
181
-
182
-
183
-
184
-
185
-
186
-
187
-
188
-
189
-
190
-
191
-
192
-
193
-
194
-
195
-
196
-
197
-
198
-
199
-
200
-
201
-
202
-
203
-
204
-
205
-
206
-
207
-
208
-
209
-
210
 |
 |

073
ANNUAL REPORT 2012/13
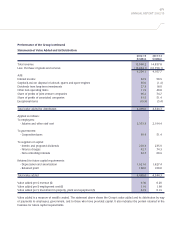
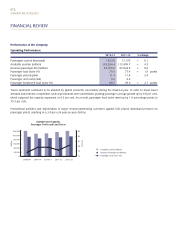
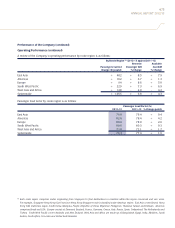
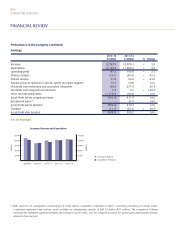
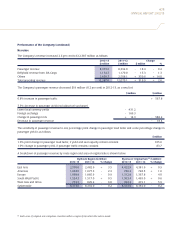
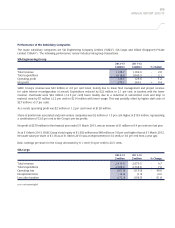
Performance of the Company (continued)
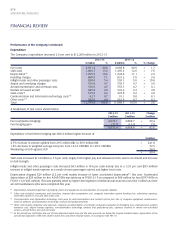
Operating Performance (continued)
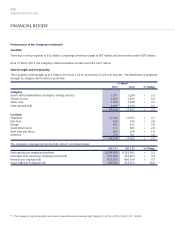
A review of the Company’s operating performance by route region is as follows:
By Route Region R4 (2012-13 against 2011-12)
Revenue Available
Passengers Carried Passenger KM Seat KM
Change (thousand) % Change % Change
East Asia + 482 + 8.5 + 7.9
Americas + 102 + 6.7 + 1.3
Europe + 94 + 8.6 + 5.0
South West Pacific + 229 + 7.3 + 6.9
West Asia and Africa + 148 - 2.0 - 4.2
Systemwide + 1,055 + 6.8 + 4.3
Passenger load factor by route region is as follows:
Passenger Load Factor (%)
2012-13 2011-12 % Change points
East Asia 76.8 76.4 + 0.4
Americas 82.6 78.4 + 4.2
Europe 80.6 78.0 + 2.6
South West Pacific 80.6 80.3 + 0.3
West Asia and Africa 73.8 72.1 + 1.7
Systemwide 79.3 77.4 + 1.9
R4 Each route region comprises routes originating from Singapore to final destinations in countries within the region concerned and vice versa.
For example, Singapore-Hong Kong-San Francisco-Hong Kong-Singapore route is classified under Americas region. East Asia covers Brunei, Hong
Kong SAR, Indonesia, Japan, South Korea, Malaysia, People’s Republic of China, Myanmar, Philippines, Thailand, Taiwan and Vietnam. Americas
comprises Brazil and USA. Europe consists of Denmark, England, France, Germany, Greece, Italy, Russia, Spain, Switzerland, The Netherlands and
Turkey. South West Pacific covers Australia and New Zealand. West Asia and Africa are made up of Bangladesh, Egypt, India, Maldives, Saudi
Arabia, South Africa, Sri Lanka and United Arab Emirates.