Singapore Airlines 2013 Annual Report Download - page 139
Download and view the complete annual report
Please find page 139 of the 2013 Singapore Airlines annual report below. You can navigate through the pages in the report by either clicking on the pages listed below, or by using the keyword search tool below to find specific information within the annual report.-
 1
1 -
2
-
3
-
4
-
5
-
6
-
7
-
8
-
9
-
10
-
11
-
12
-
13
-
14
-
15
-
16
-
17
-
18
-
19
-
20
-
21
-
22
-
23
-
24
-
25
-
26
-
27
-
28
-
29
-
30
-
31
-
32
-
33
-
34
-
35
-
36
-
37
-
38
-
39
-
40
-
41
-
42
-
43
-
44
-
45
-
46
-
47
-
48
-
49
-
50
-
51
-
52
-
53
-
54
-
55
-
56
-
57
-
58
-
59
-
60
-
61
-
62
-
63
-
64
-
65
-
66
-
67
-
68
-
69
-
70
-
71
-
72
-
73
-
74
-
75
-
76
-
77
-
78
-
79
-
80
-
81
-
82
-
83
-
84
-
85
-
86
-
87
-
88
-
89
-
90
-
91
-
92
-
93
-
94
-
95
-
96
-
97
-
98
-
99
-
100
-
101
-
102
-
103
-
104
-
105
-
106
-
107
-
108
-
109
-
110
-
111
-
112
-
113
-
114
-
115
-
116
-
117
-
118
-
119
-
120
-
121
-
122
-
123
-
124
-
125
-
126
-
127
-
128
-
 129
129 -
 130
130 -
 131
131 -
 132
132 -
 133
133 -
 134
134 -
 135
135 -
 136
136 -
 137
137 -
 138
138 -
 139
139 -
 140
140 -
 141
141 -
 142
142 -
 143
143 -
 144
144 -
 145
145 -
 146
146 -
 147
147 -
 148
148 -
 149
149 -
150
-
151
-
152
-
153
-
154
-
155
-
156
-
157
-
158
-
159
-
160
-
161
-
162
-
163
-
164
-
165
-
166
-
167
-
168
-
169
-
170
-
171
-
172
-
173
-
174
-
175
-
176
-
177
-
178
-
179
-
180
-
181
-
182
-
183
-
184
-
185
-
186
-
187
-
188
-
189
-
190
-
191
-
192
-
193
-
194
-
195
-
196
-
197
-
198
-
199
-
200
-
201
-
202
-
203
-
204
-
205
-
206
-
207
-
208
-
209
-
210
 |
 |

137
ANNUAL REPORT 2012/13
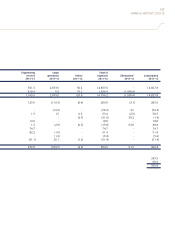
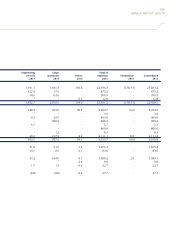
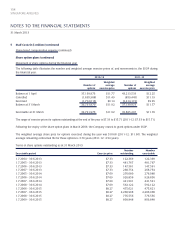
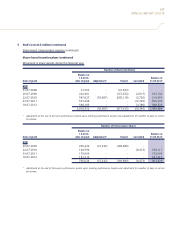
5 Staff Costs (in $ million) (continued)
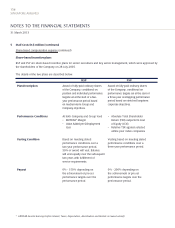
Share-based compensation expense (continued)
Share-based incentive plans (continued)
Movement of share awards during the financial year
Number of Restricted Shares
Balance at
1.4.2012/ Balance at
Date of grant date of grant Adjustment* Vested Cancelled 31.03.2013
RSP
01.07.2008 91,553 - (91,553) - -
29.07.2009 222,401 - (115,252) (2,017) 105,132
22.07.2010 547,027 (59,807) (265,110) (2,720) 219,390
01.07.2011 573,268 - - (17,729) 555,539
10.07.2012 584,103 - - (3,780) 580,323
2,018,352 (59,807) (471,915) (26,246) 1,460,384
* Adjustment at the end of two-year performance period upon meeting performance targets and adjustments for number of days in service
for retirees.
Number of Performance Shares
Balance at
1.4.2012/ Balance at
Date of grant date of grant Adjustment# Vested Cancelled 31.03.2013
PSP
29.07.2009 205,222 (15,342) (189,880) - -
22.07.2010 164,590 - - (8,473) 156,117
01.07.2011 153,999 - - - 153,999
10.07.2012 181,213 - - - 181,213
705,024 (15,342) (189,880) (8,473) 491,329
# Adjustment at the end of three-year performance period upon meeting performance targets and adjustment for number of days in service
for retirees.