Singapore Airlines 2013 Annual Report Download - page 160
Download and view the complete annual report
Please find page 160 of the 2013 Singapore Airlines annual report below. You can navigate through the pages in the report by either clicking on the pages listed below, or by using the keyword search tool below to find specific information within the annual report.-
 1
1 -
2
-
3
-
4
-
5
-
6
-
7
-
8
-
9
-
10
-
11
-
12
-
13
-
14
-
15
-
16
-
17
-
18
-
19
-
20
-
21
-
22
-
23
-
24
-
25
-
26
-
27
-
28
-
29
-
30
-
31
-
32
-
33
-
34
-
35
-
36
-
37
-
38
-
39
-
40
-
41
-
42
-
43
-
44
-
45
-
46
-
47
-
48
-
49
-
50
-
51
-
52
-
53
-
54
-
55
-
56
-
57
-
58
-
59
-
60
-
61
-
62
-
63
-
64
-
65
-
66
-
67
-
68
-
69
-
70
-
71
-
72
-
73
-
74
-
75
-
76
-
77
-
78
-
79
-
80
-
81
-
82
-
83
-
84
-
85
-
86
-
87
-
88
-
89
-
90
-
91
-
92
-
93
-
94
-
95
-
96
-
97
-
98
-
99
-
100
-
101
-
102
-
103
-
104
-
105
-
106
-
107
-
108
-
109
-
110
-
111
-
112
-
113
-
114
-
115
-
116
-
117
-
118
-
119
-
120
-
121
-
122
-
123
-
124
-
125
-
126
-
127
-
128
-
129
-
130
-
131
-
132
-
133
-
134
-
135
-
136
-
137
-
138
-
139
-
140
-
141
-
142
-
143
-
144
-
145
-
146
-
147
-
148
-
149
-
 150
150 -
 151
151 -
 152
152 -
 153
153 -
 154
154 -
 155
155 -
 156
156 -
 157
157 -
 158
158 -
 159
159 -
 160
160 -
 161
161 -
 162
162 -
 163
163 -
 164
164 -
 165
165 -
 166
166 -
 167
167 -
 168
168 -
 169
169 -
 170
170 -
171
-
172
-
173
-
174
-
175
-
176
-
177
-
178
-
179
-
180
-
181
-
182
-
183
-
184
-
185
-
186
-
187
-
188
-
189
-
190
-
191
-
192
-
193
-
194
-
195
-
196
-
197
-
198
-
199
-
200
-
201
-
202
-
203
-
204
-
205
-
206
-
207
-
208
-
209
-
210
 |
 |

158
SINGAPORE AIRLINES
NOTES TO THE FINANCIAL STATEMENTS
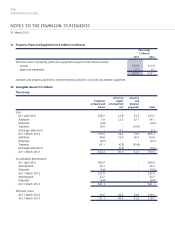
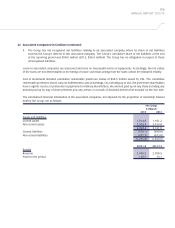
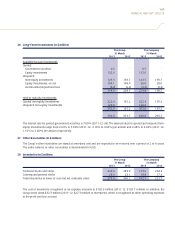
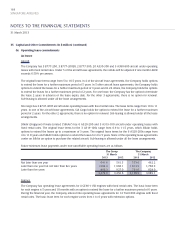
24 Associated Companies (in $ million)
The Group
31 March
2013 2012
Share of net assets of associated companies at acquisition date 466.0 471.8
Goodwill on acquisition of associated companies 1,677.2 1,677.2
2,143.2 2,149.0
Accumulated impairment loss (15.0) (20.8)
2,128.2 2,128.2
Goodwill written off to reserves (1,612.3) (1,612.3)
Foreign currency translation reserve (183.1) (179.1)
Share of post-acquisition reserves
- general reserve 140.0 136.3
- fair value reserve (38.6) (37.6)
- capital reserve 120.2 107.7
554.4 543.2
Loans to associated companies - 4.5
Write-down of loans - (4.5)
- -
554.4 543.2
The Company
31 March
2013 2012
Investment in associated companies (at cost)
Unquoted equity investments 1,646.7 1,646.7
Quoted equity investments 63.8 63.8
1,710.5 1,710.5
Accumulated impairment loss (1,178.0) (9.4)
532.5 1,701.1
Market value of quoted equity investments 182.6 206.8
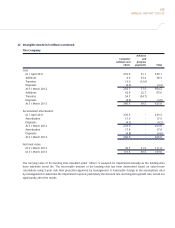
During the financial year:
1. RCMS Properties Private Limited recorded a revaluation gain of $62.3 million (2011-12: $89.7 million) from its annual
revaluation exercise of its land and building. The Group’s share of the revaluation gain of $12.5 million (2012: $17.9
million) at 31 March 2013 is included under the share of post-acquisition capital reserve.
2. The Group divested its 20% interest in an associated company, PT Purosani Sri Persada (“PTPSP”) to PT Suryaraya
Investama. Following the divestment, PTPSP ceased to be an associated company of the Group. The loan to PTPSP
which was fully provided for was written off. The Group recognised a gain on disposal of $8.3 million (Note 9).
3. The Company recorded an impairment loss of $1,168.6 million on its investment in Virgin Atlantic Limited (“VAL”) to
write down its carrying value to a recoverable value of USD360.0 million ($447.0 million). The impairment loss is only
recognised at the Company level as the investment in VAL has been fully written down at the Group level.
31 March 2013