Singapore Airlines 2013 Annual Report Download - page 82
Download and view the complete annual report
Please find page 82 of the 2013 Singapore Airlines annual report below. You can navigate through the pages in the report by either clicking on the pages listed below, or by using the keyword search tool below to find specific information within the annual report.-
 1
1 -
2
-
3
-
4
-
5
-
6
-
7
-
8
-
9
-
10
-
11
-
12
-
13
-
14
-
15
-
16
-
17
-
18
-
19
-
20
-
21
-
22
-
23
-
24
-
25
-
26
-
27
-
28
-
29
-
30
-
31
-
32
-
33
-
34
-
35
-
36
-
37
-
38
-
39
-
40
-
41
-
42
-
43
-
44
-
45
-
46
-
47
-
48
-
49
-
50
-
51
-
52
-
53
-
54
-
55
-
56
-
57
-
58
-
59
-
60
-
61
-
62
-
63
-
64
-
65
-
66
-
67
-
68
-
69
-
70
-
71
-
 72
72 -
 73
73 -
 74
74 -
 75
75 -
 76
76 -
 77
77 -
 78
78 -
 79
79 -
 80
80 -
 81
81 -
 82
82 -
 83
83 -
 84
84 -
 85
85 -
 86
86 -
 87
87 -
 88
88 -
 89
89 -
 90
90 -
 91
91 -
 92
92 -
93
-
94
-
95
-
96
-
97
-
98
-
99
-
100
-
101
-
102
-
103
-
104
-
105
-
106
-
107
-
108
-
109
-
110
-
111
-
112
-
113
-
114
-
115
-
116
-
117
-
118
-
119
-
120
-
121
-
122
-
123
-
124
-
125
-
126
-
127
-
128
-
129
-
130
-
131
-
132
-
133
-
134
-
135
-
136
-
137
-
138
-
139
-
140
-
141
-
142
-
143
-
144
-
145
-
146
-
147
-
148
-
149
-
150
-
151
-
152
-
153
-
154
-
155
-
156
-
157
-
158
-
159
-
160
-
161
-
162
-
163
-
164
-
165
-
166
-
167
-
168
-
169
-
170
-
171
-
172
-
173
-
174
-
175
-
176
-
177
-
178
-
179
-
180
-
181
-
182
-
183
-
184
-
185
-
186
-
187
-
188
-
189
-
190
-
191
-
192
-
193
-
194
-
195
-
196
-
197
-
198
-
199
-
200
-
201
-
202
-
203
-
204
-
205
-
206
-
207
-
208
-
209
-
210
 |
 |

080
SINGAPORE AIRLINES
FINANCIAL REVIEW
Performance of the Subsidiary Companies (continued)
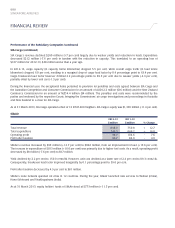
SIA Cargo (continued)
SIA Cargo’s revenue declined $260 million (-9.7 per cent) largely due to weaker yields and reduction in loads. Expenditure
decreased $212 million (-7.6 per cent) in tandem with the reduction in capacity. This translated to an operating loss of
$167 million for 2012-13, $48 million worse than a year ago.
In 2012-13, cargo capacity (in capacity tonne kilometres) dropped 5.5 per cent, while overall cargo traffic (in load tonne
kilometres) dropped 6.0 per cent, resulting in a marginal drop of cargo load factor by 0.4 percentage point to 63.4 per cent.
Cargo breakeven load factor however climbed 2.2 percentage points to 69.5 per cent due to weaker yields (-4.3 per cent),
partially offset by lower unit cost (-1.3 per cent).
During the financial year, the exceptional items pertained to provision for penalties and costs agreed between SIA Cargo and
the Australian Competition and Consumer Commission for an amount of AUD12.2 million ($16 million) and the New Zealand
Commerce Commission for an amount of NZD4.4 million ($4 million). The penalties and costs were recommended by the
parties and endorsed by the respective Courts, bringing the Commissions’ air cargo investigations and proceedings in Australia
and New Zealand to a close for SIA Cargo.
As at 31 March 2013, SIA Cargo operated a fleet of 12 B747-400 freighters. SIA Cargo’s equity was $1,309 million (-11.4 per cent).
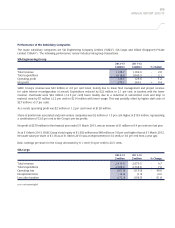
SilkAir
2012-13 2011-12
$ million $ million % Change
Total revenue 846.0 750.8 + 12.7
Total expenditure 749.3 646.2 + 16.0
Operating profit 96.7 104.6 - 7.6
Profit after taxation 80.7 84.9 - 4.9
SilkAir’s revenue increased by $95 million (+12.7 per cent) to $846 million, from an improvement in load (+15.6 per cent).
The increase in expenditure of $103 million (+16.0 per cent) was primarily due to higher fuel costs. As a result, operating profit
decreased by $8 million (-7.6 per cent) to $97 million.
Yield declined by 2.2 per cent to 150.0 cents/ltk. However, unit cost declined at a faster rate of 2.4 per cent to 89.3 cents/ctk.
Consequently, breakeven load factor improved marginally by 0.1 percentage point to 59.6 per cent.
Profit after taxation decreased by 4.9 per cent to $81 million.
SilkAir’s route network spanned 42 cities in 12 countries. During the year, SilkAir launched new services to Wuhan (China),
Hanoi (Vietnam) and Visakhapatnam (India).
As at 31 March 2013, equity holders’ funds of SilkAir stood at $773 million (+11.5 per cent).