Sharp 2015 Annual Report Download - page 5
Download and view the complete annual report
Please find page 5 of the 2015 Sharp annual report below. You can navigate through the pages in the report by either clicking on the pages listed below, or by using the keyword search tool below to find specific information within the annual report.-
 1
1 -
 2
2 -
 3
3 -
 4
4 -
 5
5 -
 6
6 -
 7
7 -
 8
8 -
 9
9 -
 10
10 -
 11
11 -
 12
12 -
 13
13 -
 14
14 -
 15
15 -
 16
16 -
17
-
18
-
19
-
20
-
21
-
22
-
23
-
24
-
25
-
26
-
27
-
28
-
29
-
30
-
31
-
32
-
33
-
34
-
35
-
36
-
37
-
38
-
39
-
40
-
41
-
42
-
43
-
44
-
45
-
46
-
47
-
48
-
49
-
50
-
51
-
52
-
53
-
54
-
55
-
56
-
57
-
58
-
59
-
60
 |
 |

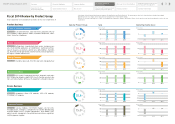
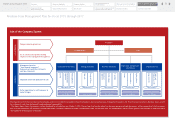
Fiscal 2014 Review by Product Group
Sharp Corporation and Consolidated Subsidiaries for the Years Ended March 31
Product Business Sales Operating Income (Loss)
Main Products LCD color televisions, color televisions, projectors, Blu-ray
Disc recorders, mobile phones, tablets, electronic dictionaries, calcu-
lators, facsimiles, telephones
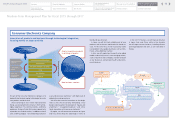
Digital Information Equipment
Health and Environmental Equipment
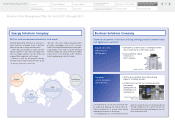
Energy Solutions
Business Solutions
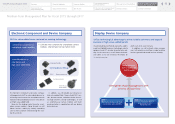
LCDs
Electronic Devices
Main Products Refrigerators, superheated steam ovens, microwave ov-
ens, small cooking appliances, air conditioners, washing machines,
vacuum cleaners, air purifiers, electric fans, dehumidifiers, humidifi-
ers, Plasmacluster Ion generators, electric heaters, beauty appliances,
LED lights, network control units
Main Products Crystalline solar cells, thin-film solar cells, storage battery
Main Products POS systems, handy data terminals, electronic cash regis-
ters, information displays, digital MFPs (multi-function printers), op-
tions and consumables, software, FA equipment, ultrasonic cleaners
Main Products Amorphous silicon LCD modules, IGZO LCD modules,
CG-Silicon LCD modules
Main Products Camera modules, CCD/CMOS imagers, LSIs for LCDs,
microprocessors, analog ICs, components for satellite broadcasting,
terrestrial digital tuners, network components, laser diodes, LEDs,
optical sensors, components for optical communications, regulators,
switching power supplies
Device Business
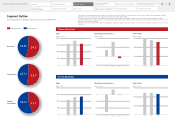
Sales by Product Group
・ Sales figures include internal sales between segments (Product Business and Device Business). The percentage of sales in pie charts has been calculated accordingly.
・ Operating income (loss) figures are the amounts before adjustments for intersegment trading.
・ Effective for the year ended March 31, 2014, the Company has changed its segment classification. Figures for the previous year have been adjusted to reflect the new
classification.
(billions of yen)
0
400
800
2013 2014 2015
22.8%
15.0%
11.5%
9.2%
10.7%
30.8%
(billions of yen)
-20
0
20
2013 2014 2015
(billions of yen)
0
200
400
2013 2014
2015
(billions of yen)
0
20
40
2013 2014
2015
0
200
400
2013 2014 2015
(billions of yen)
0
20
40
2013 2014 2015
(billions of yen)
0
150
450
2013 2014 2015
300
(billions of yen)
-20
-10
10
2013 2014 2015
0
(billions of yen)
0
400
1,200
2013 2014 2015
800
(billions of yen)
-150
-100
-50
50
0
2013 2014 2015
(billions of yen)
(billions of yen)
0
300
450
2013 2014 2015
150
(billions of yen)
-80
0
40
2013 2014 2015
-40
3
Fiscal 2014 Review by
Product Group
Segment Outline
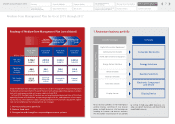
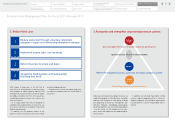
Medium-Term Management Plan
for Fiscal 2015 through 2017
Financial Section
Investor Information
Directors, Audit & Supervisory Board
Members and Executive Officers
Risk Factors
Corporate Governance
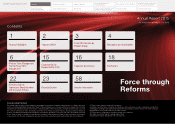
Contents
Corporate Social
Responsibility (CSR)
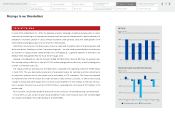
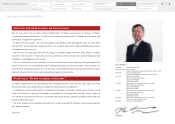
Message to our Shareholders
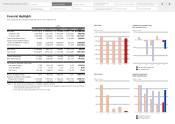
Financial Highlights
SHARP Annual Report 2015