Sharp 2015 Annual Report Download - page 3
Download and view the complete annual report
Please find page 3 of the 2015 Sharp annual report below. You can navigate through the pages in the report by either clicking on the pages listed below, or by using the keyword search tool below to find specific information within the annual report.-
 1
1 -
 2
2 -
 3
3 -
 4
4 -
 5
5 -
 6
6 -
 7
7 -
 8
8 -
 9
9 -
 10
10 -
 11
11 -
 12
12 -
 13
13 -
 14
14 -
15
-
16
-
17
-
18
-
19
-
20
-
21
-
22
-
23
-
24
-
25
-
26
-
27
-
28
-
29
-
30
-
31
-
32
-
33
-
34
-
35
-
36
-
37
-
38
-
39
-
40
-
41
-
42
-
43
-
44
-
45
-
46
-
47
-
48
-
49
-
50
-
51
-
52
-
53
-
54
-
55
-
56
-
57
-
58
-
59
-
60
 |
 |

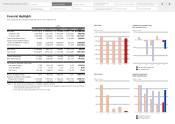
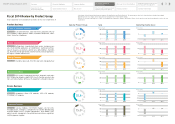
Financial Highlights
Sharp Corporation and Consolidated Subsidiaries for the Years Ended March 31
Yen
(millions)
2011 2012 2013 2014 2015
Net Sales ¥ 3,021,973 ¥ 2,455,850 ¥ 2,478,586 ¥ 2,927,186 ¥ 2,786,256
Domestic sales 1,592,909 1,181,168 1,007,264 1,150,091 968,449
Overseas sales 1,429,064 1,274,682 1,471,322 1,777,095 1,817,807
Operating Income (Loss) 78,896 (37,552) (146,266) 108,560 (48,065)
Income (Loss) before Income
Taxes and Minority Interests 40,880 (238,429) (466,187) 45,970 (188,834)
Net Income (Loss) 19,401 (376,076) (545,347) 11,559 (222,347)
Net Assets 1,048,645 645,120 134,837 207,173 44,515
Total Assets 2,885,678 2,614,135 2,087,763 2,181,680 1,961,909
Capital Investment 172,553 118,899 82,458 49,434 62,653
R&D Expenditures 173,983 154,798 137,936 132,124 141,042
Per Share of Common Stock (yen)
Net income (loss) 17.63 (341.78) (489.83) 8.09 (131.51)
Cash dividends 17.00 10.00 0.00 0.00 0.00
Net assets 932.46 568.83 106.90 115.43 17.84
Return on Equity (ROE) 1.9% (45.5%) (145.3%) 7.2% (197.4%)
Number of Shares Outstanding
(thousands of shares) 1,100,346 1,100,324 1,166,224 1,690,765 1,690,733
Number of Employees 55,580 56,756 50,647 50,253 49,096
(Notes) 1. The amount of leased properties is included in capital investment.
2. The computation of net income (loss) per share is based on the weighted average number of shares of common
stock outstanding during each fiscal year.
3. The number of shares outstanding is net of treasury stock.
Net Sales Operating Income (Loss)
Net Income (Loss)
Operating Income (Loss)
Net Income (Loss)
200
-400
-600
(billions of yen)
500
1,000
1,500
3,500
3,000
2,500
2,000
0
0
151411 12 13 151411 12 13
-200
(billions of yen)
Capital Investment
R&D Expenditures
Capital Investment
R&D Expenditures
Net Assets
(billions of yen)
200
100
0151411 12 13
150
50
1,200
300
900
151411 12 13
600
0
(billions of yen)
1
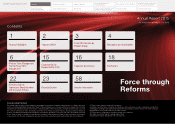
Financial Highlights
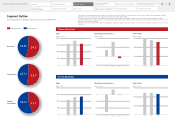
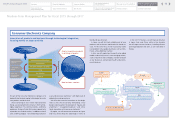
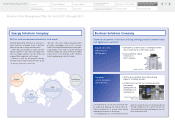
Segment Outline
Financial Section
Investor Information
Directors, Audit & Supervisory Board
Members and Executive Officers
Risk Factors
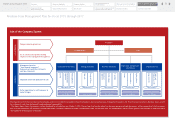
Corporate Governance
Contents
Corporate Social
Responsibility (CSR)
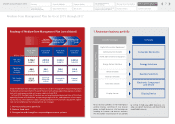
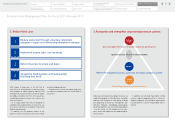
Medium-Term Management Plan
for Fiscal 2015 through 2017
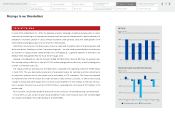
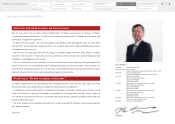
Message to our Shareholders
Fiscal 2014 Review by
Product Group
SHARP Annual Report 2015