Sharp 2015 Annual Report Download - page 49
Download and view the complete annual report
Please find page 49 of the 2015 Sharp annual report below. You can navigate through the pages in the report by either clicking on the pages listed below, or by using the keyword search tool below to find specific information within the annual report.-
 1
1 -
2
-
3
-
4
-
5
-
6
-
7
-
8
-
9
-
10
-
11
-
12
-
13
-
14
-
15
-
16
-
17
-
18
-
19
-
20
-
21
-
22
-
23
-
24
-
25
-
26
-
27
-
28
-
29
-
30
-
31
-
32
-
33
-
34
-
35
-
36
-
37
-
38
-
 39
39 -
 40
40 -
 41
41 -
 42
42 -
 43
43 -
 44
44 -
 45
45 -
 46
46 -
 47
47 -
 48
48 -
 49
49 -
 50
50 -
 51
51 -
 52
52 -
 53
53 -
 54
54 -
 55
55 -
 56
56 -
 57
57 -
 58
58 -
 59
59 -
60
 |
 |

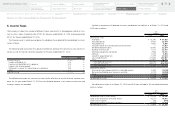
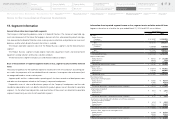
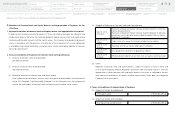
13. Segment Information
General information about reportable segments
The Company’s chief operating decision maker is its Board of Directors. The Company’s reportable seg-
ments are components of the Group that engage in business activities, whose operating results are regu-
larly reviewed by the Board of Directors when making resource allocation and performance assessment
decisions, and for which discrete financial information is available.
The Group’s reportable segments consist of the Product Business segment and the Device Business
segment.
The Product Business segment includes digital information equipment, health and environmental
equipment, energy solutions and business solutions products.
The Device Business segment includes LCDs and electronic devices products.
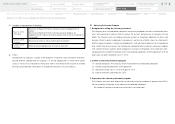
Basis of measurement of reported segment income or loss, segment assets and other material
items
The accounting policies for the reportable segments are consistent with the Company’s accounting poli-
cies used in the preparation of its consolidated financial statements. Intersegment sales and income (loss)
are recognized based on current market prices.
Segment profit and loss is determined as operating profit less basic research and development costs
and administrative expenses related to the Company’s corporate headquarters.
Depreciable assets of sales and distribution groups of the Company’s headquarters and the sales
subsidiaries depreciable assets not directly allocated to product groups are not allocated to reportable
segments. On the other hand, depreciation and amortization of these assets are allocated to reportable
segments based mainly on sales of each reportable segment.
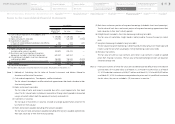
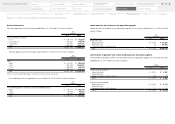
Information about reported segment income or loss, segment assets and other material items
Segment information as of and for the years ended March 31, 2014 and 2015 was as follows:
Yen (millions)
2014 2015
Net Sales:
Product Business:
Customers ¥ 1,818,097 ¥ 1,596,552
Intersegment 71 79
Total 1,818,168 1,596,631
Device Business:
Customers 1,109,089 1,189,704
Intersegment 208,378 158,870
Total 1,317,467 1,348,574
Eliminations (208,449) (158,949)
Consolidated Net Sales ¥ 2,927,186 ¥ 2,786,256
Segment Income (Loss):
Product Business ¥ 96,802 ¥ (12,295)
Device Business 44,853 1,270
Adjustments (33,095) (37,040)
Consolidated operating (loss) income ¥ 108,560 ¥ (48,065)
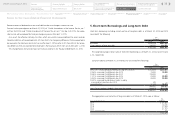
Segment Assets:
Product Business ¥ 839,474 ¥ 778,092
Device Business 726,209 698,006
Adjustments 615,997 485,811
Consolidated Assets ¥ 2,181,680 ¥ 1,961,909
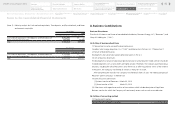
Other Material Items
Depreciation and Amortization:
Product Business ¥ 38,605 ¥ 49,739
Device Business 81,667 57,219
Adjustments 4,311 4,680
The amount presented in Consolidated Financial Statements ¥ 124,583 ¥ 111,638
Amortization of Goodwill:
Product Business ¥ 4,072 ¥ 2,542
Device Business — —
Adjustments 65 11
The amount presented in Consolidated Financial Statements ¥ 4,137 ¥ 2,553
Investments in Nonconsolidated Subsidiaries and Affiliates accounted
for using the equity methods:
Product Business ¥ 6,529 ¥ 4,286
Device Business 75,217 72,507
Adjustments 28,310 31,098
The amount presented in Consolidated Financial Statements ¥ 110,056 ¥ 107,891
Increase in Plant, Equipment and Intangible Assets:
Product Business ¥ 45,356 ¥ 52,797
Device Business 30,436 37,518
Adjustments 6,308 8,169
The amount presented in Consolidated Financial Statements ¥ 82,100 ¥ 98,484
Notes to the Consolidated Financial Statements
47
Notes to the Consolidated
Financial Statements
Financial Section
Segment Outline
Medium-Term Management Plan
for Fiscal 2015 through 2017
Investor Information
Directors, Audit & Supervisory Board
Members and Executive Officers
Risk Factors
Corporate Governance
Contents
Corporate Social
Responsibility (CSR)
Message to our Shareholders
Fiscal 2014 Review by
Product Group
Financial Highlights
SHARP Annual Report 2015
Consolidated
Subsidiaries
Independent Auditor’s
Report
Consolidated Statements of
Cash Flows
Consolidated Statements of
Changes in Net Assets
Consolidated Statements of
Comprehensive Income
Consolidated Statements of
Operations
Consolidated Balance Sheets
Financial Review
Five-Year Financial Summary