Sharp 2015 Annual Report Download - page 26
Download and view the complete annual report
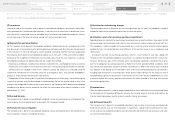
Please find page 26 of the 2015 Sharp annual report below. You can navigate through the pages in the report by either clicking on the pages listed below, or by using the keyword search tool below to find specific information within the annual report.-
 1
1 -
2
-
3
-
4
-
5
-
6
-
7
-
8
-
9
-
10
-
11
-
12
-
13
-
14
-
15
-
 16
16 -
 17
17 -
 18
18 -
 19
19 -
 20
20 -
 21
21 -
 22
22 -
 23
23 -
 24
24 -
 25
25 -
 26
26 -
 27
27 -
 28
28 -
 29
29 -
 30
30 -
 31
31 -
 32
32 -
 33
33 -
 34
34 -
 35
35 -
 36
36 -
37
-
38
-
39
-
40
-
41
-
42
-
43
-
44
-
45
-
46
-
47
-
48
-
49
-
50
-
51
-
52
-
53
-
54
-
55
-
56
-
57
-
58
-
59
-
60
 |
 |

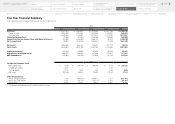
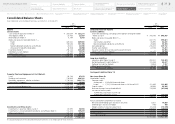
Five-Year Financial Summary
Sharp Corporation and Consolidated Subsidiaries for the Years Ended March 31
Yen
(millions)
2011 2012 2013 2014 2015
Net Sales ¥ 3,021,973 ¥ 2,455,850 ¥ 2,478,586 ¥ 2,927,186 ¥ 2,786,256
Domestic sales 1,592,909 1,181,168 1,007,264 1,150,091 968,449
Overseas sales 1,429,064 1,274,682 1,471,322 1,777,095 1,817,807
Operating Income (Loss) 78,896 (37,552) (146,266) 108,560 (48,065)
Income (Loss) before Income Taxes and Minority Interests 40,880 (238,429) (466,187) 45,970 (188,834)
Net Income (Loss) 19,401 (376,076) (545,347) 11,559 (222,347)
Net Assets 1,048,645 645,120 134,837 207,173 44,515
Total Assets 2,885,678 2,614,135 2,087,763 2,181,680 1,961,909
Capital Investment*1172,553 118,899 82,458 49,434 62,653
Depreciation and Amortization 289,602 269,020 197,880 132,401 117,323
R&D Expenditures 173,983 154,798 137,936 132,124 141,042
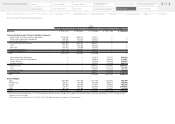
Yen
Per Share of Common Stock
Net income (loss) ¥ 17.63 ¥ (341.78) ¥ (489.83) ¥ 8.09 ¥ (131.51)
Diluted net income 16.47 — — 7.87 —
Cash dividends 17.00 10.00 0.00 0.00 0.00
Net assets 932.46 568.83 106.90 115.43 17.84
Other Financial Data
Return on equity (ROE) 1.9% (45.5%) (145.3%) 7.2% (197.4%)
Return on assets (ROA) 0.7% (13.7%) (23.2%) 0.5% (10.7%)
Equity ratio 35.6% 23.9% 6.0% 8.9% 1.5%
*1 The amount of leased properties is included in capital investment.
24
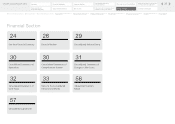
Financial Section
Five-Year Financial Summary
Segment Outline
Medium-Term Management Plan
for Fiscal 2015 through 2017
Investor Information
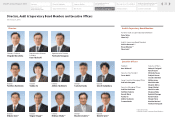
Directors, Audit & Supervisory Board
Members and Executive Officers
Risk Factors
Corporate Governance
Contents
Corporate Social
Responsibility (CSR)
Message to our Shareholders
Fiscal 2014 Review by
Product Group
Financial Highlights
SHARP Annual Report 2015
Consolidated
Subsidiaries
Independent Auditor’s
Report
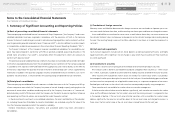
Notes to the Consolidated
Financial Statements
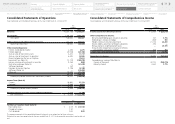
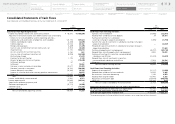
Consolidated Statements of
Cash Flows
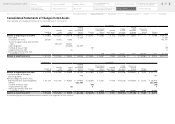
Consolidated Statements of
Changes in Net Assets
Consolidated Statements of
Comprehensive Income
Consolidated Statements of
Operations
Consolidated Balance Sheets
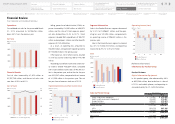
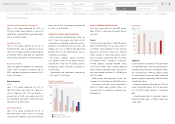
Financial Review