Sharp 2015 Annual Report Download - page 28
Download and view the complete annual report
Please find page 28 of the 2015 Sharp annual report below. You can navigate through the pages in the report by either clicking on the pages listed below, or by using the keyword search tool below to find specific information within the annual report.-
 1
1 -
2
-
3
-
4
-
5
-
6
-
7
-
8
-
9
-
10
-
11
-
12
-
13
-
14
-
15
-
16
-
17
-
 18
18 -
 19
19 -
 20
20 -
 21
21 -
 22
22 -
 23
23 -
 24
24 -
 25
25 -
 26
26 -
 27
27 -
 28
28 -
 29
29 -
 30
30 -
 31
31 -
 32
32 -
 33
33 -
 34
34 -
 35
35 -
 36
36 -
 37
37 -
 38
38 -
39
-
40
-
41
-
42
-
43
-
44
-
45
-
46
-
47
-
48
-
49
-
50
-
51
-
52
-
53
-
54
-
55
-
56
-
57
-
58
-
59
-
60
 |
 |

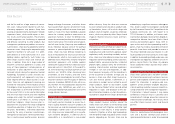
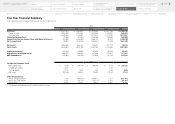
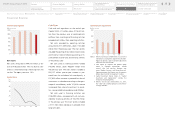
Financial Review
Sharp Corporation and Consolidated Subsidiaries
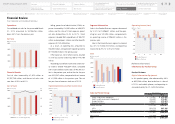
Operations
Consolidated net sales for the year ended March
31, 2015 amounted to ¥2,786,256 million,
down 4.8% from the previous year.
Financial Results
Cost of sales increased by ¥1,405 million to
¥2,397,749 million, and the cost of sales ratio
rose from 81.9% to 86.1%.
Selling, general and administrative (SG&A) ex-
penses increased by ¥14,290 million to ¥436,572
million, and the ratio of SG&A expenses against
net sales climbed from 14.4% to 15.7%. SG&A
expenses included R&D expenditures of ¥36,707
million and employees’ salaries and other benefits
expenses of ¥120,448 million.
As a result, an operating loss amounted to
¥48,065 million, compared with operating income
of ¥108,560 million in the previous year.
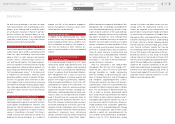
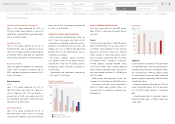
Other expenses, net of other income, resulted
in a net loss position and amounted to ¥140,769
million.
Accordingly, loss before income taxes and minor-
ity interests totaled ¥188,834 million, compared
with income before income taxes of ¥45,970 mil-
lion in the previous year, and net loss for the year
was ¥222,347 million, compared with net income
of ¥11,559 million in the previous year. The net
loss per share of common stock was ¥131.51.
Segment Information
Sales in the Product Business segment decreased
by 12.2% to ¥1,596,631 million, and the oper-
ating loss was ¥12,295 million, compared with
an operating income of ¥96,802 million in the
previous year.
Sales in the Device Business segment increased
by 2.4% to ¥1,348,574 million, and operating
income fell by 97.2% to ¥1,270 million.
[Reference Information]
Information by Product Group
Product Business
Digital Information Equipment
In this product group, sales decreased by 8.6%
to ¥670,388 million, due to declines in sales of
LCD TVs and mobile phones, and operating in-
come declined by 76.2% to ¥3,054 million.
Net Sales
(billions of yen)
151411 12 13
3,000
2,000
1,000
0
4,000
Sales
(billions of yen)
2,000
1,500
1,000
500
0
2,500
151411 12 13
Product Business
Device Business
Operating Income (Loss)
(billions of yen)
-50
-100
-150
-200
100
50
0
151411 12 13
Product Business
Device Business
Cost of Sales
(billions of yen) (%)
2,000
1,000
0
3,000
60
30
0
90
151411 12 13
Ratio to net sales [right axis]
Operating Income (Loss)/Net Income (Loss)
(billions of yen)
0
100
-100
-200
-300
-400
-500
-600
200
151411 12 13
Operating income (loss)
Net income (loss)
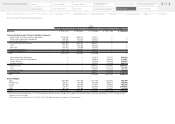
Sales by Product Group Yen (millions)
2014 2015
Digital Information Equipment ¥ 733,361 ¥ 670,388
Health and Environmental Equipment 326,890 315,037
Energy Solutions 439,040 270,874
Business Solutions 318,877 340,332
Product Business 1,818,168 1,596,631
LCDs 991,074 907,105
Electronic Devices 326,393 441,469
Device Business 1,317,467 1,348,574
Adjustments (208,449) (158,949)
Total 2,927,186 2,786,256
26
Financial Review
Financial Section
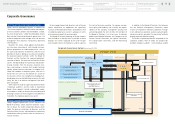
Segment Outline
Medium-Term Management Plan
for Fiscal 2015 through 2017
Investor Information
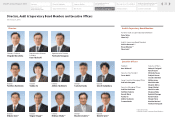
Directors, Audit & Supervisory Board
Members and Executive Officers
Risk Factors
Corporate Governance
Contents
Corporate Social
Responsibility (CSR)
Message to our Shareholders
Fiscal 2014 Review by
Product Group
Financial Highlights
SHARP Annual Report 2015
Consolidated
Subsidiaries
Independent Auditor’s
Report
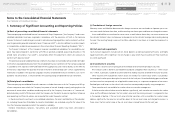
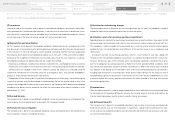
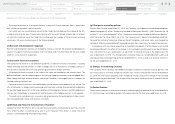
Notes to the Consolidated
Financial Statements
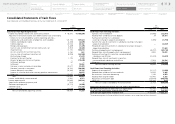
Consolidated Statements of
Cash Flows
Consolidated Statements of
Changes in Net Assets
Consolidated Statements of
Comprehensive Income
Consolidated Statements of
Operations
Consolidated Balance Sheets
Five-Year Financial Summary