Sharp 2015 Annual Report Download - page 48
Download and view the complete annual report
Please find page 48 of the 2015 Sharp annual report below. You can navigate through the pages in the report by either clicking on the pages listed below, or by using the keyword search tool below to find specific information within the annual report.-
 1
1 -
2
-
3
-
4
-
5
-
6
-
7
-
8
-
9
-
10
-
11
-
12
-
13
-
14
-
15
-
16
-
17
-
18
-
19
-
20
-
21
-
22
-
23
-
24
-
25
-
26
-
27
-
28
-
29
-
30
-
31
-
32
-
33
-
34
-
35
-
36
-
37
-
 38
38 -
 39
39 -
 40
40 -
 41
41 -
 42
42 -
 43
43 -
 44
44 -
 45
45 -
 46
46 -
 47
47 -
 48
48 -
 49
49 -
 50
50 -
 51
51 -
 52
52 -
 53
53 -
 54
54 -
 55
55 -
 56
56 -
 57
57 -
 58
58 -
59
-
60
 |
 |

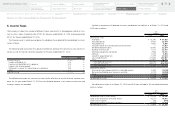
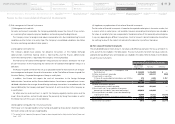
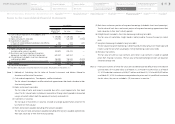
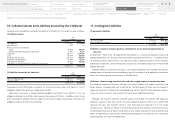
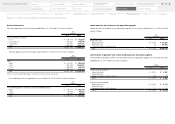
Reconciliations of the defined benefit obligation and the fair value of the plan assets and the amount
recognized in the consolidated balance sheets as of March 31, 2014 and 2015 consisted of the following:
Amounts recognized in remeasurements of defined benefit plans (accumulated other comprehensive
income) as of March 31, 2014 and 2015 before the effect of income taxes consisted of the following:
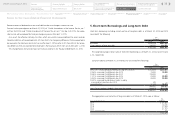
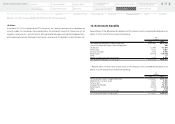
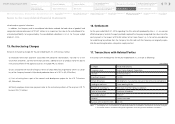
Classification of the fair value of plan assets of the Company and its consolidated subsidiaries as of
March 31, 2014 and 2015 consisted of the following:
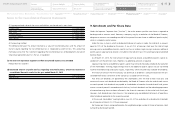
Long-term expected rate of return
Current and target asset allocations, historical and expected returns on various categories of plan assets
have been considered in determining the long-term expected rate of return.
The discount rate used by the Company and its domestic consolidated subsidiaries for the years ended
March 31, 2014 and 2015 was 1.5%.
The Long-term expected rate of return used by the Company and its domestic consolidated subsidiar-
ies for the years ended March 31, 2014 and 2015 was 3.0%.
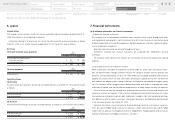
In addition, cost recognized for the defined contribution pension plans was ¥1,279 million as of March
31, 2014 and ¥1,131 million as of March 31, 2015.
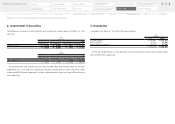
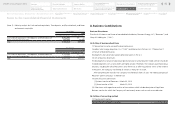
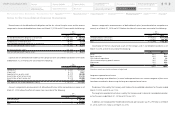
Expenses for net defined benefit liability of the Company and its consolidated subsidiaries for the years
ended March 31, 2014 and 2015 consisted of the following:
Amounts recognized in remeasurements of defined benefit plans (other comprehensive income) as of
March 31, 2015 before the effect of income taxes consisted of the following:
Yen
(millions)
2014 2015
Funded defined benefit obligation at end of year ¥ 370,832 ¥ 383,728
Fair value of plan assets at end of year (274,341) (304,574)
Funded status at the end of year 96,491 79,154
Unfunded defined benefit obligation at end of year 4,892 6,123
Total net defined benefit liability (asset) ¥ 101,383 ¥ 85,277
Net defined benefit liability 101,383 85,277
Total net defined benefit liability (asset) ¥ 101,383 ¥ 85,277
Yen
(millions)
2014 2015
Service cost ¥ 12,489 ¥ 11,979
Interest cost 6,712 7,027
Expected return on plan assets (8,107) (8,938)
Amortization of net actuarial loss 17,810 21,818
Amortization of past service cost (3,512) (4,553)
Other (17) 153
Total expenses for net defined benefit liability ¥ 25,375 ¥ 27,486
Yen
(millions)
2014 2015
Past service cost — ¥ (4,519)
Net actuarial gain — 31,604
Total — ¥ 27,085
Yen
(millions)
2014 2015
Unrecognized past service cost ¥ (16,502) ¥ (11,983)
Unrecognized net actuarial loss 131,951 100,346
Total ¥ 115,449 ¥ 88,363
2014 2015
Bonds 35% 31%
Equity securities 23% 26%
Cash and cash equivalents 9% 1%
Life insurance company general accounts 18% 17%
Alternatives 13% 23%
Other 2% 2%
Total 100% 100%
Notes to the Consolidated Financial Statements
Alternatives mainly consisted of investment in hedge funds.
46
Notes to the Consolidated
Financial Statements
Financial Section
Segment Outline
Medium-Term Management Plan
for Fiscal 2015 through 2017
Investor Information
Directors, Audit & Supervisory Board
Members and Executive Officers
Risk Factors
Corporate Governance
Contents
Corporate Social
Responsibility (CSR)
Message to our Shareholders
Fiscal 2014 Review by
Product Group
Financial Highlights
SHARP Annual Report 2015
Consolidated
Subsidiaries
Independent Auditor’s
Report
Consolidated Statements of
Cash Flows
Consolidated Statements of
Changes in Net Assets
Consolidated Statements of
Comprehensive Income
Consolidated Statements of
Operations
Consolidated Balance Sheets
Financial Review
Five-Year Financial Summary