Sharp 2015 Annual Report Download - page 30
Download and view the complete annual report
Please find page 30 of the 2015 Sharp annual report below. You can navigate through the pages in the report by either clicking on the pages listed below, or by using the keyword search tool below to find specific information within the annual report.-
 1
1 -
2
-
3
-
4
-
5
-
6
-
7
-
8
-
9
-
10
-
11
-
12
-
13
-
14
-
15
-
16
-
17
-
18
-
19
-
 20
20 -
 21
21 -
 22
22 -
 23
23 -
 24
24 -
 25
25 -
 26
26 -
 27
27 -
 28
28 -
 29
29 -
 30
30 -
 31
31 -
 32
32 -
 33
33 -
 34
34 -
 35
35 -
 36
36 -
 37
37 -
 38
38 -
 39
39 -
 40
40 -
41
-
42
-
43
-
44
-
45
-
46
-
47
-
48
-
49
-
50
-
51
-
52
-
53
-
54
-
55
-
56
-
57
-
58
-
59
-
60
 |
 |

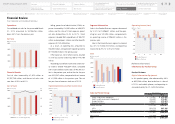
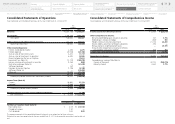
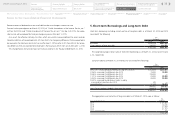
Net Assets
Net assets amounted to ¥44,515 million, a de-
cline of ¥162,658 million. This was due to a de-
crease in retained earnings stemming from the
net loss. The equity ratio was 1.5%.
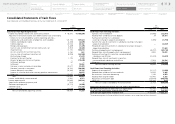
Cash Flows
Cash and cash equivalents at the end of year
stood at ¥232,211 million, down ¥118,423 mil-
lion from the previous year, as combined cash
outflows from investing and financing activities
exceeded cash inflows from operating activities.
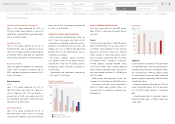
Net cash provided by operating activities
amounted to ¥17,339 million, down ¥181,645
million from the previous year. The main factors
included the posting of loss before income taxes
and minority interests following a posting of in-
come before income taxes and minority interests
in the previous year.
Net cash used in investing activities totaled
¥16,043 million, down ¥68,897 million from
the previous year. The main factors included a
¥20,127 million year-on-year increase in pro-
ceeds from the withdrawal of time deposits, a
¥17,633 million increase in proceeds for sales of
investments in subsidiaries resulting in change in
scope of consolidation, and a ¥12,818 increase
in proceeds from sales of investments in securi-
ties, nonconsolidated subsidiaries and affiliates.
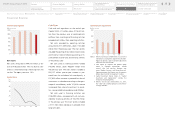
Net cash used in financing activities was
¥136,090 million, compared with net cash pro-
vided by financing activities of ¥32,753 million
in the previous year. The main factors included
a ¥177,160 million decrease in proceeds from
long-term debt.
Notes: 1. Effective for the year ended March 31, 2014, the
Company has changed its segment classification.
Figures for previous years have been adjusted to
reflect the new classification.
2. Sales figures by segment and product group
shown in “Segment Information” include
internal sales and transfers between seg-
ments (Product Business and Device Business).
Operating income (loss) figures are the amounts
before adjustment for intersegment trading.
3. Capital investment figures shown in “Capital
Investment and Depreciation” include the
amount of leased properties.
4. Effective for the year ended March 31, 2015,
the “Solar Cells” product group was renamed as
“Energy Solutions.”
Cash and Cash Equivalents
(billions of yen)
300
200
100
0
400
151411 12 13
Interest-Bearing Debt
(billions of yen)
1,000
800
600
200
400
0
1,200
151411 12 13
Equity Ratio
(%)
40
30
20
10
0
50
151411 12 13
Financial Review
28
Financial Review
Financial Section
Segment Outline
Medium-Term Management Plan
for Fiscal 2015 through 2017
Investor Information
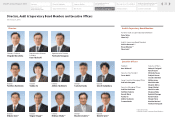
Directors, Audit & Supervisory Board
Members and Executive Officers
Risk Factors
Corporate Governance
Contents
Corporate Social
Responsibility (CSR)
Message to our Shareholders
Fiscal 2014 Review by
Product Group
Financial Highlights
SHARP Annual Report 2015
Consolidated
Subsidiaries
Independent Auditor’s
Report
Notes to the Consolidated
Financial Statements
Consolidated Statements of
Cash Flows
Consolidated Statements of
Changes in Net Assets
Consolidated Statements of
Comprehensive Income
Consolidated Statements of
Operations
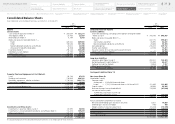
Consolidated Balance Sheets
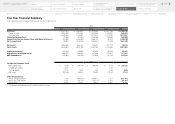
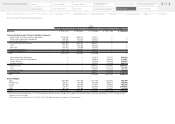
Five-Year Financial Summary