Salesforce.com 2014 Annual Report Download - page 68
Download and view the complete annual report
Please find page 68 of the 2014 Salesforce.com annual report below. You can navigate through the pages in the report by either clicking on the pages listed below, or by using the keyword search tool below to find specific information within the annual report.-
 1
1 -
2
-
3
-
4
-
5
-
6
-
7
-
8
-
9
-
10
-
11
-
12
-
13
-
14
-
15
-
16
-
17
-
18
-
19
-
20
-
21
-
22
-
23
-
24
-
25
-
26
-
27
-
28
-
29
-
30
-
31
-
32
-
33
-
34
-
35
-
36
-
37
-
38
-
39
-
40
-
41
-
42
-
43
-
44
-
45
-
46
-
47
-
48
-
49
-
50
-
51
-
52
-
53
-
54
-
55
-
56
-
57
-
 58
58 -
 59
59 -
 60
60 -
 61
61 -
 62
62 -
 63
63 -
 64
64 -
 65
65 -
 66
66 -
 67
67 -
 68
68 -
 69
69 -
 70
70 -
 71
71 -
 72
72 -
 73
73 -
 74
74 -
 75
75 -
 76
76 -
 77
77 -
 78
78 -
79
-
80
-
81
-
82
-
83
-
84
-
85
-
86
-
87
-
88
-
89
-
90
-
91
-
92
-
93
-
94
-
95
-
96
-
97
-
98
-
99
-
100
-
101
-
102
-
103
-
104
-
105
-
106
-
107
-
108
-
109
-
110
-
111
-
112
-
113
-
114
-
115
-
116
-
117
-
118
-
119
-
120
-
121
-
122
-
123
-
124
-
125
-
126
-
127
-
128
 |
 |

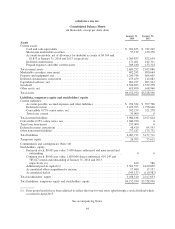
salesforce.com, inc.
Consolidated Balance Sheets
(in thousands, except per share data)
January 31,
2014
January 31,
2013
Assets
Current assets:
Cash and cash equivalents ............................................ $ 781,635 $ 747,245
Short-term marketable securities ....................................... 57,139 120,376
Accounts receivable, net of allowance for doubtful accounts of $4,769 and
$1,853 at January 31, 2014 and 2013, respectively ...................... 1,360,837 872,634
Deferred commissions ............................................... 171,461 142,311
Prepaid expenses and other current assets ............................... 309,180 133,314
Total current assets ..................................................... 2,680,252 2,015,880
Marketable securities, noncurrent .......................................... 482,243 890,664
Property and equipment, net .............................................. 1,240,746 604,669
Deferred commissions, noncurrent ......................................... 153,459 112,082
Capitalized software, net ................................................. 481,917 207,323
Goodwill ............................................................. 3,500,823 1,529,378
Other assets, net ........................................................ 613,490 168,960
Total assets ........................................................... $9,152,930 $5,528,956
Liabilities, temporary equity and stockholders’ equity
Current liabilities:
Accounts payable, accrued expenses and other liabilities ................... $ 934,324 $ 597,706
Deferred revenue ................................................... 2,473,705 1,798,640
Convertible 0.75% senior notes, net .................................... 542,159 521,278
Term loan, current .................................................. 30,000 0
Total current liabilities .................................................. 3,980,188 2,917,624
Convertible 0.25% senior notes, net ........................................ 1,046,930 0
Term loan, noncurrent ................................................... 255,000 0
Deferred revenue, noncurrent ............................................. 48,410 64,355
Other noncurrent liabilities ............................................... 757,187 175,732
Total liabilities ........................................................ 6,087,715 3,157,711
Temporary equity ...................................................... 26,705 53,612
Commitments and contingencies (Note 10)
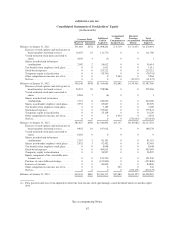
Stockholders’ equity:
Preferred stock, $0.001 par value; 5,000 shares authorized and none issued and
outstanding ..................................................... 0 0
Common stock, $0.001 par value; 1,600,000 shares authorized, 610,143 and
585,627 issued and outstanding at January 31, 2014 and 2013,
respectively (1) .................................................. 610 586
Additional paid-in capital (1) ......................................... 3,363,377 2,410,892
Accumulated other comprehensive income .............................. 17,680 17,137
Accumulated deficit ................................................ (343,157) (110,982)
Total stockholders’ equity ................................................ 3,038,510 2,317,633
Total liabilities, temporary equity and stockholders’ equity ...................... $9,152,930 $5,528,956
(1) Prior period results have been adjusted to reflect the four-for-one stock split through a stock dividend which
occurred in April 2013.
See accompanying Notes.
64