Salesforce.com 2014 Annual Report Download - page 52
Download and view the complete annual report
Please find page 52 of the 2014 Salesforce.com annual report below. You can navigate through the pages in the report by either clicking on the pages listed below, or by using the keyword search tool below to find specific information within the annual report.-
 1
1 -
2
-
3
-
4
-
5
-
6
-
7
-
8
-
9
-
10
-
11
-
12
-
13
-
14
-
15
-
16
-
17
-
18
-
19
-
20
-
21
-
22
-
23
-
24
-
25
-
26
-
27
-
28
-
29
-
30
-
31
-
32
-
33
-
34
-
35
-
36
-
37
-
38
-
39
-
40
-
41
-
 42
42 -
 43
43 -
 44
44 -
 45
45 -
 46
46 -
 47
47 -
 48
48 -
 49
49 -
 50
50 -
 51
51 -
 52
52 -
 53
53 -
 54
54 -
 55
55 -
 56
56 -
 57
57 -
 58
58 -
 59
59 -
 60
60 -
 61
61 -
 62
62 -
63
-
64
-
65
-
66
-
67
-
68
-
69
-
70
-
71
-
72
-
73
-
74
-
75
-
76
-
77
-
78
-
79
-
80
-
81
-
82
-
83
-
84
-
85
-
86
-
87
-
88
-
89
-
90
-
91
-
92
-
93
-
94
-
95
-
96
-
97
-
98
-
99
-
100
-
101
-
102
-
103
-
104
-
105
-
106
-
107
-
108
-
109
-
110
-
111
-
112
-
113
-
114
-
115
-
116
-
117
-
118
-
119
-
120
-
121
-
122
-
123
-
124
-
125
-
126
-
127
-
128
 |
 |

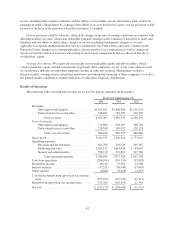
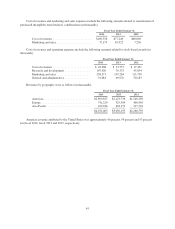
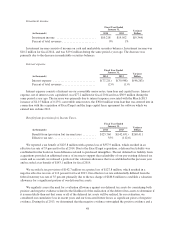
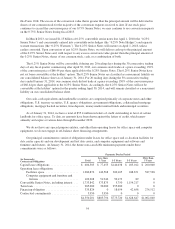
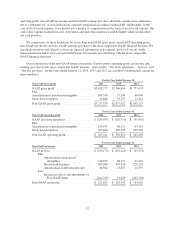
Investment income.
Fiscal Year Ended
January 31, Variance
Dollars(in thousands) 2014 2013
Investment income ........................... $10,218 $19,562 $(9,344)
Percent of total revenues ....................... 0% 1%
Investment income consists of income on cash and marketable securities balances. Investment income was
$10.2 million for fiscal 2014, and was $19.6 million during the same period a year ago. The decrease was
primarily due to the decrease in marketable securities balances.
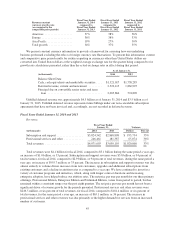
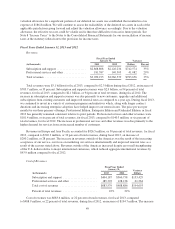
Interest expense.
Fiscal Year Ended
January 31, Variance
Dollars(in thousands) 2014 2013
Interest expense ............................. $(77,211) $(30,948) $(46,263)
Percent of total revenues ....................... (2)% (1)%
Interest expense consists of interest on our convertible senior notes, term loan and capital leases. Interest
expense, net of interest costs capitalized, was $77.2 million for fiscal 2014 and was $30.9 million during the
same period a year ago. The increase was primarily due to interest expense associated with the March 2013
issuance of $1.15 billion of 0.25% convertible senior notes, the $300.0 million term loan that was entered into in
connection with the acquisition of ExactTarget and the large capital lease agreement for software which we
entered into in June 2013.
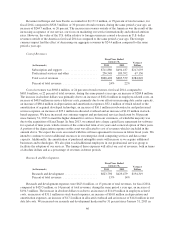
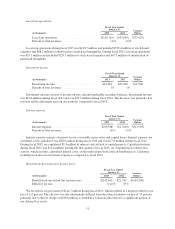
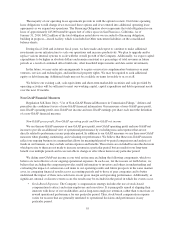
Benefit from (provision for) Income Taxes.
Fiscal Year Ended
January 31, Variance
Dollars(in thousands) 2014 2013
Benefit from (provision for) income taxes ......... $125,760 $(142,651) $268,411
Effective tax rate ............................. 35% (112)%
We reported a tax benefit of $125.8 million with a pretax loss of $357.9 million, which resulted in an
effective tax rate of 35 percent for fiscal 2014. Due to the ExactTarget acquisition, a deferred tax liability was
established for the book-tax basis difference related to purchased intangibles. The net deferred tax liability from
acquisitions provided an additional source of income to support the realizability of our pre-existing deferred tax
assets and as a result, we released a portion of the valuation allowance that was established in the previous year
and recorded a tax benefit of $143.1 million for fiscal 2014.
We recorded a tax provision of $142.7 million on a pretax loss of $127.8 million, which resulted in a
negative effective tax rate of 112 percent for fiscal 2013. Our effective tax rate substantially differed from the
federal statutory tax rate of 35 percent primarily due to the tax charge of $186.8 million to establish a valuation
allowance for a significant portion of our deferred tax assets.
We regularly assess the need for a valuation allowance against our deferred tax assets by considering both
positive and negative evidence related to the likelihood of the realization of the deferred tax assets to determine if
it is more-likely-than-not that some or all of the deferred tax assets will be realized. In our evaluation, we
considered our cumulative loss in recent years and our forecasted future losses as significant pieces of negative
evidence. During fiscal 2013, we determined that the negative evidence outweighed the positive evidence and a
48