Salesforce.com 2014 Annual Report Download - page 49
Download and view the complete annual report
Please find page 49 of the 2014 Salesforce.com annual report below. You can navigate through the pages in the report by either clicking on the pages listed below, or by using the keyword search tool below to find specific information within the annual report.-
 1
1 -
2
-
3
-
4
-
5
-
6
-
7
-
8
-
9
-
10
-
11
-
12
-
13
-
14
-
15
-
16
-
17
-
18
-
19
-
20
-
21
-
22
-
23
-
24
-
25
-
26
-
27
-
28
-
29
-
30
-
31
-
32
-
33
-
34
-
35
-
36
-
37
-
38
-
 39
39 -
 40
40 -
 41
41 -
 42
42 -
 43
43 -
 44
44 -
 45
45 -
 46
46 -
 47
47 -
 48
48 -
 49
49 -
 50
50 -
 51
51 -
 52
52 -
 53
53 -
 54
54 -
 55
55 -
 56
56 -
 57
57 -
 58
58 -
 59
59 -
60
-
61
-
62
-
63
-
64
-
65
-
66
-
67
-
68
-
69
-
70
-
71
-
72
-
73
-
74
-
75
-
76
-
77
-
78
-
79
-
80
-
81
-
82
-
83
-
84
-
85
-
86
-
87
-
88
-
89
-
90
-
91
-
92
-
93
-
94
-
95
-
96
-
97
-
98
-
99
-
100
-
101
-
102
-
103
-
104
-
105
-
106
-
107
-
108
-
109
-
110
-
111
-
112
-
113
-
114
-
115
-
116
-
117
-
118
-
119
-
120
-
121
-
122
-
123
-
124
-
125
-
126
-
127
-
128
 |
 |

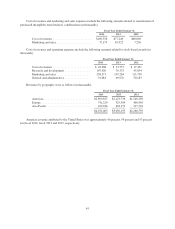
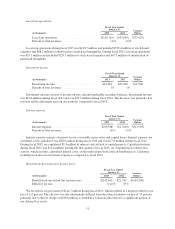
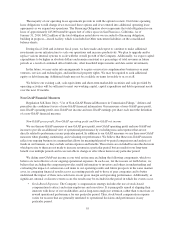
Revenue constant
currency growth rates
(as compared to the
comparable prior periods)
Fiscal Year Ended
January 31, 2014
compared to
Fiscal Year Ended
January 31, 2013
Fiscal Year Ended
January 31, 2013
compared to
Fiscal Year Ended
January 31, 2012
Fiscal Year Ended
January 31, 2012
compared to
Fiscal Year Ended
January 31, 2011
Americas ................... 37% 38% 36%
Europe ..................... 36% 38% 33%
Asia Pacific ................. 19% 27% 30%
Total growth ................ 34% 37% 35%
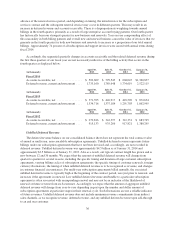
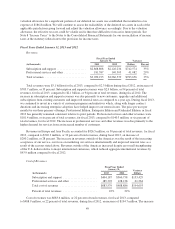
We present constant currency information to provide a framework for assessing how our underlying
business performed excluding the effect of foreign currency rate fluctuations. To present this information, current
and comparative prior period results for entities reporting in currencies other than United States dollars are
converted into United States dollars at the weighted average exchange rate for the quarter being compared to for
growth rate calculations presented, rather than the actual exchange rates in effect during that period.
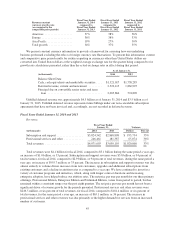
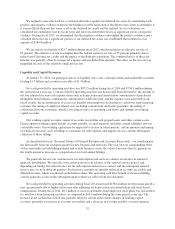
As of January 31,
(in thousands) 2014 2013
Balance Sheet Data:
Cash, cash equivalents and marketable securities .... $1,321,017 $1,758,285
Deferred revenue, current and noncurrent ......... 2,522,115 1,862,995
Principal due on convertible senior notes and term
loan ..................................... 2,003,864 574,890
Unbilled deferred revenue was approximately $4.5 billion as of January 31, 2014 and $3.5 billion as of
January 31, 2013. Unbilled deferred revenue represents future billings under our non-cancelable subscription
agreements that have not been invoiced and, accordingly, are not recorded in deferred revenue.
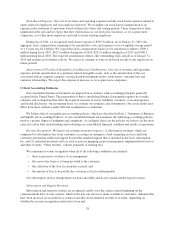
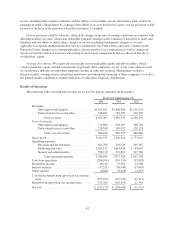
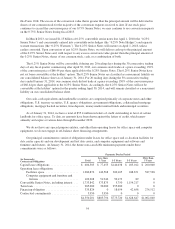
Fiscal Years Ended January 31, 2014 and 2013
Revenues.
Fiscal Year Ended
January 31, Variance
(in thousands) 2014 2013 Dollars Percent
Subscription and support .................. $3,824,542 $2,868,808 $ 955,734 33%
Professional services and other ............. 246,461 181,387 65,074 36%
Total revenues .......................... $4,071,003 $3,050,195 $1,020,808 33%
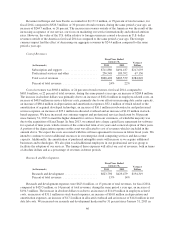
Total revenues were $4.1 billion for fiscal 2014, compared to $3.1 billion during the same period a year ago,
an increase of $1.0 billion, or 33 percent. Subscription and support revenues were $3.8 billion, or 94 percent of
total revenues, for fiscal 2014, compared to $2.9 billion, or 94 percent of total revenues, during the same period a
year ago, an increase of $955.7 million, or 33 percent. The increase in subscription and support revenues was due
almost entirely to volume-driven increases from new customers, upgrades and additional subscriptions from
existing customers and a decline in attrition rates as compared to a year ago. We have continued to invest in a
variety of customer programs and initiatives, which, along with longer contract durations and increasing
enterprise adoption, have helped reduce our attrition rates. The net price per user per month for our three primary
offerings, Professional Edition, Enterprise Edition and Unlimited Edition, varies from period to period, but has
remained within a consistent range over the past eight quarters. The net price per user per month has not been a
significant driver of revenue growth for the periods presented. Professional services and other revenues were
$246.5 million, or six percent of total revenues, for fiscal 2014, compared to $181.4 million, or six percent of
total revenues, for the same period a year ago, an increase of $65.1 million, or 36 percent. The increase in
professional services and other revenues was due primarily to the higher demand for services from an increased
number of customers.
45