Salesforce.com 2014 Annual Report Download - page 50
Download and view the complete annual report
Please find page 50 of the 2014 Salesforce.com annual report below. You can navigate through the pages in the report by either clicking on the pages listed below, or by using the keyword search tool below to find specific information within the annual report.-
 1
1 -
2
-
3
-
4
-
5
-
6
-
7
-
8
-
9
-
10
-
11
-
12
-
13
-
14
-
15
-
16
-
17
-
18
-
19
-
20
-
21
-
22
-
23
-
24
-
25
-
26
-
27
-
28
-
29
-
30
-
31
-
32
-
33
-
34
-
35
-
36
-
37
-
38
-
39
-
 40
40 -
 41
41 -
 42
42 -
 43
43 -
 44
44 -
 45
45 -
 46
46 -
 47
47 -
 48
48 -
 49
49 -
 50
50 -
 51
51 -
 52
52 -
 53
53 -
 54
54 -
 55
55 -
 56
56 -
 57
57 -
 58
58 -
 59
59 -
 60
60 -
61
-
62
-
63
-
64
-
65
-
66
-
67
-
68
-
69
-
70
-
71
-
72
-
73
-
74
-
75
-
76
-
77
-
78
-
79
-
80
-
81
-
82
-
83
-
84
-
85
-
86
-
87
-
88
-
89
-
90
-
91
-
92
-
93
-
94
-
95
-
96
-
97
-
98
-
99
-
100
-
101
-
102
-
103
-
104
-
105
-
106
-
107
-
108
-
109
-
110
-
111
-
112
-
113
-
114
-
115
-
116
-
117
-
118
-
119
-
120
-
121
-
122
-
123
-
124
-
125
-
126
-
127
-
128
 |
 |

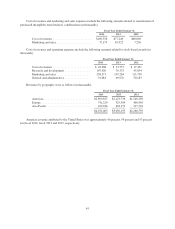
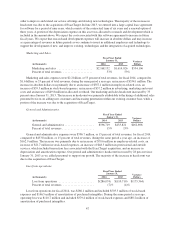
Revenues in Europe and Asia Pacific accounted for $1,171.2 million, or 29 percent of total revenues, for
fiscal 2014, compared to $926.5 million, or 30 percent of total revenues, during the same period a year ago, an
increase of $244.7 million, or 26 percent. The increase in revenues outside of the Americas was the result of the
increasing acceptance of our service, our focus on marketing our service internationally and reduced attrition
rates. However, the value of the U.S. dollar relative to foreign currencies caused a decrease in U.S. dollar
revenues outside of the Americas for fiscal 2014 as compared to the same period a year ago. The foreign
currency impact had the effect of decreasing our aggregate revenues by $24.4 million compared to the same
period a year ago.
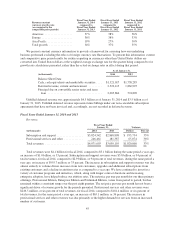
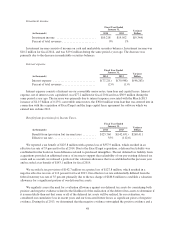
Cost of Revenues.
Fiscal Year Ended
January 31, Variance
Dollars(in thousands) 2014 2013
Subscription and support ....................... $711,880 $494,187 $217,693
Professional services and other .................. 256,548 189,392 67,156
Total cost of revenues ......................... $968,428 $683,579 $284,849
Percent of total revenues ....................... 24% 22%
Cost of revenues was $968.4 million, or 24 percent of total revenues, for fiscal 2014, compared to
$683.6 million, or 22 percent of total revenues, during the same period a year ago, an increase of $284.8 million.
The increase in absolute dollars was primarily due to an increase of $102.8 million in employee-related costs, an
increase of $48.9 million in service delivery costs, primarily due to our efforts in increasing data center capacity,
an increase of $80.4 million in depreciation and amortization expenses, $32.1 million of which related to the
amortization of acquired developed technology, an increase of $16.1 million in subcontractor and professional
services expense, an increase of $23.1 million in allocated overhead and an increase of $11.9 million in stock-
based expenses. We have increased our customer support and professional services headcount by 58 percent
since January 31, 2013 to meet the higher demand for services from our customers, of which the majority was
due to the acquisition of ExactTarget. In June 2013, we entered into a large capital lease agreement for software
for a period of nine years, which consists of the contractual term of six years and a renewal option of three years.
A portion of the depreciation expense on this asset was allocated to cost of revenues which is included in the
amount above. We expect the costs associated with this software agreement to increase in future fiscal years. We
intend to continue to invest additional resources in our enterprise cloud computing services and data center
capacity. Additionally, the amortization of purchased intangible assets will increase as we acquire additional
businesses and technologies. We also plan to add additional employees in our professional services group to
facilitate the adoption of our services. The timing of these expenses will affect our cost of revenues, both in terms
of absolute dollars and as a percentage of revenues in future periods.
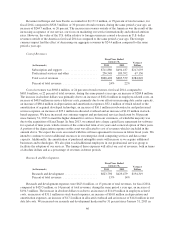
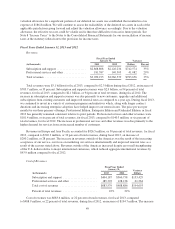
Research and Development.
Fiscal Year Ended
January 31, Variance
Dollars(in thousands) 2014 2013
Research and development ...................... $623,798 $429,479 $194,319
Percent of total revenues ....................... 15% 14%
Research and development expenses were $623.8 million, or 15 percent of total revenues, for fiscal 2014,
compared to $429.5 million, or 14 percent of total revenues, during the same period a year ago, an increase of
$194.3 million. The increase in absolute dollars was due to an increase of $114.9 million in employee-related
costs, an increase of $31.1 million in stock-based expenses, an increase of $16.0 million in depreciation and
amortization expenses, an increase of $17.2 million in allocated overhead and an increase of $14.8 million in test
data lab costs. We increased our research and development headcount by 31 percent since January 31, 2013 in
46