Salesforce.com 2014 Annual Report Download - page 46
Download and view the complete annual report
Please find page 46 of the 2014 Salesforce.com annual report below. You can navigate through the pages in the report by either clicking on the pages listed below, or by using the keyword search tool below to find specific information within the annual report.-
 1
1 -
2
-
3
-
4
-
5
-
6
-
7
-
8
-
9
-
10
-
11
-
12
-
13
-
14
-
15
-
16
-
17
-
18
-
19
-
20
-
21
-
22
-
23
-
24
-
25
-
26
-
27
-
28
-
29
-
30
-
31
-
32
-
33
-
34
-
35
-
 36
36 -
 37
37 -
 38
38 -
 39
39 -
 40
40 -
 41
41 -
 42
42 -
 43
43 -
 44
44 -
 45
45 -
 46
46 -
 47
47 -
 48
48 -
 49
49 -
 50
50 -
 51
51 -
 52
52 -
 53
53 -
 54
54 -
 55
55 -
 56
56 -
57
-
58
-
59
-
60
-
61
-
62
-
63
-
64
-
65
-
66
-
67
-
68
-
69
-
70
-
71
-
72
-
73
-
74
-
75
-
76
-
77
-
78
-
79
-
80
-
81
-
82
-
83
-
84
-
85
-
86
-
87
-
88
-
89
-
90
-
91
-
92
-
93
-
94
-
95
-
96
-
97
-
98
-
99
-
100
-
101
-
102
-
103
-
104
-
105
-
106
-
107
-
108
-
109
-
110
-
111
-
112
-
113
-
114
-
115
-
116
-
117
-
118
-
119
-
120
-
121
-
122
-
123
-
124
-
125
-
126
-
127
-
128
 |
 |

factors, including future market conditions and the ability to successfully execute the business plans and/or tax
planning strategies. Should there be a change in the ability to recover deferred tax assets, our tax provision would
increase or decrease in the period in which the assessment is changed.
Our tax provision could be adversely affected by changes in the mix of earnings and losses in countries with
differing statutory tax rates, certain non-deductible expenses, changes in the valuation of deferred tax assets and
liabilities and our ability to utilize them, changes in tax laws including fundamental changes to tax laws
applicable to corporate multinationals that may be considered by the United States and many countries in the
European Union, changes in accounting principles, adverse results of tax examinations as well as changes in
excess tax benefits related to exercises and vesting of stock-based compensation that are allocated directly to
stockholders’ equity.
Strategic Investments. We report our investments in non-marketable equity and debt securities, which
consist of minority equity and debt investments in privately-held companies, at cost or fair value when an event
or circumstance indicates an other-than-temporary decline in value has occurred. Management evaluates
financial results, earnings trends, technology milestones and subsequent financing of these companies, as well as
the general market conditions to identify indicators of other-than-temporary impairment.
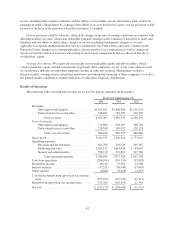
Results of Operations
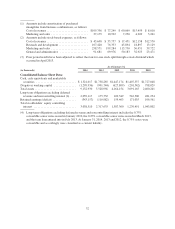
The following tables set forth selected data for each of the periods indicated (in thousands):
Fiscal Year Ended January 31,
2014 2013 2012
Revenues:
Subscription and support ............... $3,824,542 $2,868,808 $2,126,234
Professional services and other .......... 246,461 181,387 140,305
Total revenues ................... 4,071,003 3,050,195 2,266,539
Cost of revenues:
Subscription and support ............... 711,880 494,187 360,758
Professional services and other .......... 256,548 189,392 128,128
Total cost of revenues ............. 968,428 683,579 488,886
Gross profit ............................. 3,102,575 2,366,616 1,777,653
Operating expenses:
Research and development ............. 623,798 429,479 295,347
Marketing and sales ................... 2,168,132 1,614,026 1,169,610
General and administrative ............. 596,719 433,821 347,781
Total operating expenses ........... 3,388,649 2,477,326 1,812,738
Loss from operations ...................... (286,074) (110,710) (35,085)
Investment income ....................... 10,218 19,562 23,268
Interest expense .......................... (77,211) (30,948) (17,045)
Other expense ........................... (4,868) (5,698) (4,455)
Loss before benefit from (provision for) income
taxes ................................. (357,935) (127,794) (33,317)
Benefit from (provision for) income taxes ..... 125,760 (142,651) 21,745
Net loss ................................ $ (232,175) $ (270,445) $ (11,572)
42