Salesforce.com 2014 Annual Report Download - page 56
Download and view the complete annual report
Please find page 56 of the 2014 Salesforce.com annual report below. You can navigate through the pages in the report by either clicking on the pages listed below, or by using the keyword search tool below to find specific information within the annual report.-
 1
1 -
2
-
3
-
4
-
5
-
6
-
7
-
8
-
9
-
10
-
11
-
12
-
13
-
14
-
15
-
16
-
17
-
18
-
19
-
20
-
21
-
22
-
23
-
24
-
25
-
26
-
27
-
28
-
29
-
30
-
31
-
32
-
33
-
34
-
35
-
36
-
37
-
38
-
39
-
40
-
41
-
42
-
43
-
44
-
45
-
 46
46 -
 47
47 -
 48
48 -
 49
49 -
 50
50 -
 51
51 -
 52
52 -
 53
53 -
 54
54 -
 55
55 -
 56
56 -
 57
57 -
 58
58 -
 59
59 -
 60
60 -
 61
61 -
 62
62 -
 63
63 -
 64
64 -
 65
65 -
 66
66 -
67
-
68
-
69
-
70
-
71
-
72
-
73
-
74
-
75
-
76
-
77
-
78
-
79
-
80
-
81
-
82
-
83
-
84
-
85
-
86
-
87
-
88
-
89
-
90
-
91
-
92
-
93
-
94
-
95
-
96
-
97
-
98
-
99
-
100
-
101
-
102
-
103
-
104
-
105
-
106
-
107
-
108
-
109
-
110
-
111
-
112
-
113
-
114
-
115
-
116
-
117
-
118
-
119
-
120
-
121
-
122
-
123
-
124
-
125
-
126
-
127
-
128
 |
 |
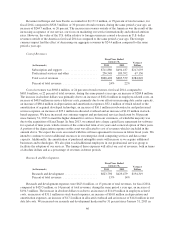
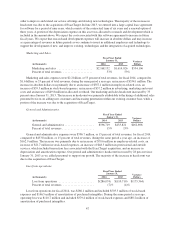
We regularly assess the need for a valuation allowance against our deferred tax assets by considering both
positive and negative evidence related to the likelihood of the realization of the deferred tax assets to determine if
it is more-likely-than-not that some or all of the deferred tax assets will be realized. In our evaluation, we
considered our cumulative loss in recent years and our forecasted future losses as significant pieces of negative
evidence. During fiscal 2013, we determined that the negative evidence outweighed the positive evidence and a
valuation allowance for a significant portion of our deferred tax assets was established that resulted in a tax
expense of $186.8 million.
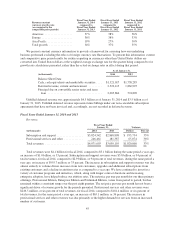
We recorded a tax benefit of $21.7 million during fiscal 2012, which resulted in an effective tax rate of
65 percent. The effective tax rate was higher than the federal statutory tax rate of 35 percent primarily due to
federal and California tax credits and the impact of the Radian6 acquisition. The combined effect of these tax
benefits was partially offset by foreign tax expense and non-deductible amounts. The effect on the tax rate was
magnified because of the relatively small pre-tax loss.
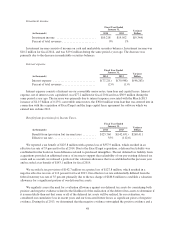
Liquidity and Capital Resources
At January 31, 2014, our principal sources of liquidity were cash, cash equivalents and marketable securities
totaling $1.3 billion and accounts receivable of $1.4 billion.
Net cash provided by operating activities was $875.5 million during fiscal 2014 and $736.9 million during
the same period a year ago. Cash provided by operating activities has historically been affected by: the amount of
net loss adjusted for non-cash expense items such as depreciation and amortization, amortization of purchased
intangibles from business combinations, amortization of debt discount, and the expense associated with stock-
based awards; the reclassification of excess tax benefits from employee stock plans to cash flows from financing
activities; the timing of employee related costs including commissions and bonus payments; the timing of
collections from our customers, which is our largest source of operating cash flows; and changes in working
capital accounts.
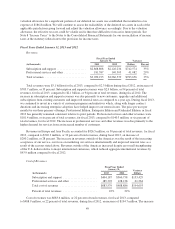
Our working capital accounts consist of accounts receivables and prepaid assets and other current assets.
Claims against working capital include accounts payable, accrued expenses and other current liabilities and our
convertible notes. Our working capital may be impacted by factors in future periods, certain amounts and timing
of which are seasonal, such as billings to customers for subscriptions and support services and the subsequent
collection of those billings.
As described above in “Seasonal Nature of Deferred Revenue and Accounts Receivable,” our fourth quarter
has historically been our strongest quarter for new business and renewals. The year on year compounding effect
of this seasonality in both billing patterns and overall business causes the value of invoices that we generate in
the fourth quarter to increase as a proportion of our total annual billings.
We generally invoice our customers for our subscription and services contracts in advance in annual or
quarterly installments. We typically issue renewal invoices in advance of the renewal service period, and
depending on timing, the initial invoice for the subscription and services contract and the subsequent renewal
invoice may occur in different quarters. Such invoice amounts are initially reflected in accounts receivable and
deferred revenue, which is reflected on the balance sheet. The operating cash flow benefit of increased billing
activity generally occurs in the subsequent quarter when we collect from our customers.
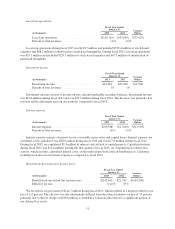
Net cash provided by operating activities during fiscal 2014 increased $138.6 million over the same period a
year ago primarily due to higher net income after adjusting for depreciation and amortization and stock-based
compensation. During fiscal 2014, $8.1 million of excess tax benefits from employee stock plans was reclassified
to cash flows from financing activities, as compared to $14.9 million during the same period a year ago. The
increase in net cash in fiscal 2014 was partially offset by certain unfavorable changes in working capital
accounts, primarily an increase in accounts receivables and a decrease in accounts payable, accrued expenses
52