Salesforce.com 2014 Annual Report Download - page 103
Download and view the complete annual report
Please find page 103 of the 2014 Salesforce.com annual report below. You can navigate through the pages in the report by either clicking on the pages listed below, or by using the keyword search tool below to find specific information within the annual report.-
 1
1 -
2
-
3
-
4
-
5
-
6
-
7
-
8
-
9
-
10
-
11
-
12
-
13
-
14
-
15
-
16
-
17
-
18
-
19
-
20
-
21
-
22
-
23
-
24
-
25
-
26
-
27
-
28
-
29
-
30
-
31
-
32
-
33
-
34
-
35
-
36
-
37
-
38
-
39
-
40
-
41
-
42
-
43
-
44
-
45
-
46
-
47
-
48
-
49
-
50
-
51
-
52
-
53
-
54
-
55
-
56
-
57
-
58
-
59
-
60
-
61
-
62
-
63
-
64
-
65
-
66
-
67
-
68
-
69
-
70
-
71
-
72
-
73
-
74
-
75
-
76
-
77
-
78
-
79
-
80
-
81
-
82
-
83
-
84
-
85
-
86
-
87
-
88
-
89
-
90
-
91
-
92
-
 93
93 -
 94
94 -
 95
95 -
 96
96 -
 97
97 -
 98
98 -
 99
99 -
 100
100 -
 101
101 -
 102
102 -
 103
103 -
 104
104 -
 105
105 -
 106
106 -
 107
107 -
 108
108 -
 109
109 -
 110
110 -
 111
111 -
 112
112 -
 113
113 -
114
-
115
-
116
-
117
-
118
-
119
-
120
-
121
-
122
-
123
-
124
-
125
-
126
-
127
-
128
 |
 |

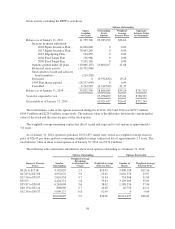
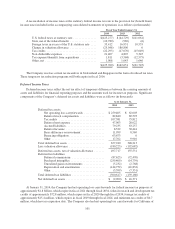
Restricted stock activity is as follows:
Restricted Stock Outstanding
Outstanding
Weighted-
Average
Exercise Price
Aggregate
Intrinsic
Value
(in thousands)
Balance as of January 31, 2012 ............ 19,849,052 $0.001
Granted ........................... 16,283,752 0.001
Cancelled ......................... (2,471,624) 0.001
Vested and converted to shares ........ (6,878,560) 0.001
Balance as of January 31, 2013 ............ 26,782,620 $0.001
Granted ........................... 10,884,991 0.001
Cancelled ......................... (3,616,383) 0.001
Vested and converted to shares ........ (9,397,650) 0.001
Balance as of January 31, 2014 ............ 24,653,578 $0.001 $1,492,281
Expected to vest ........................ 21,442,620 $1,297,922
The restricted stock, which upon vesting entitles the holder to one share of common stock for each share of
restricted stock, has an exercise price of $0.001 per share, which is equal to the par value of the Company’s
common stock, and generally vest over 4 years.
The weighted-average grant date fair value of the restricted stock issued for fiscal 2014, 2013 and 2012 was
$46.99, $37.71 and $30.47, respectively.
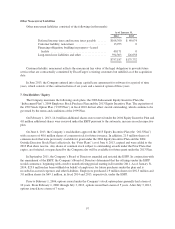
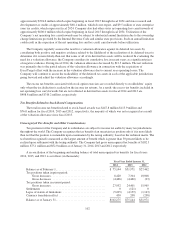
Common Stock
The following number of shares of common stock were reserved and available for future issuance at
January 31, 2014:
Options outstanding .............................. 28,604,045
Restricted stock awards and units outstanding ......... 24,653,578
Stock available for future grant:
2013 Equity Incentive Plan .................... 55,626,162
2006 Inducement Equity Incentive Plan .......... 226,374
2004 Employee Stock Purchase Plan ............ 6,114,165
Convertible senior notes ...................... 43,965,164
Warrants .................................. 44,252,692
203,442,180
During fiscal years 2014, 2013 and 2012, certain board members received stock grants totaling 108,800
shares of common stock, 102,400 shares of common stock and 147,200 shares of common stock, respectively for
board services pursuant to the terms described in the 2013 Plan and previously, the 2004 Outside Directors Stock
Plan. The expense related to these awards, which was expensed immediately at the time of the issuance, totaled
$4.5 million, $3.8 million and $4.9 million for fiscal 2014, 2013 and 2012, respectively.
Preferred Stock
The Company’s board of directors has the authority, without further action by stockholders, to issue up to
5,000,000 shares of preferred stock in one or more series. The Company’s board of directors may designate the
rights, preferences, privileges and restrictions of the preferred stock, including dividend rights, conversion rights,
99