Salesforce.com 2012 Annual Report Download - page 91
Download and view the complete annual report
Please find page 91 of the 2012 Salesforce.com annual report below. You can navigate through the pages in the report by either clicking on the pages listed below, or by using the keyword search tool below to find specific information within the annual report.-
 1
1 -
2
-
3
-
4
-
5
-
6
-
7
-
8
-
9
-
10
-
11
-
12
-
13
-
14
-
15
-
16
-
17
-
18
-
19
-
20
-
21
-
22
-
23
-
24
-
25
-
26
-
27
-
28
-
29
-
30
-
31
-
32
-
33
-
34
-
35
-
36
-
37
-
38
-
39
-
40
-
41
-
42
-
43
-
44
-
45
-
46
-
47
-
48
-
49
-
50
-
51
-
52
-
53
-
54
-
55
-
56
-
57
-
58
-
59
-
60
-
61
-
62
-
63
-
64
-
65
-
66
-
67
-
68
-
69
-
70
-
71
-
72
-
73
-
74
-
75
-
76
-
77
-
78
-
79
-
80
-
 81
81 -
 82
82 -
 83
83 -
 84
84 -
 85
85 -
 86
86 -
 87
87 -
 88
88 -
 89
89 -
 90
90 -
 91
91 -
 92
92 -
 93
93 -
 94
94 -
 95
95 -
 96
96 -
 97
97 -
 98
98 -
 99
99 -
 100
100 -
 101
101 -
102
-
103
-
104
-
105
-
106
-
107
-
108
-
109
-
110
-
111
-
112
-
113
-
114
-
115
-
116
-
117
-
118
-
119
-
120
 |
 |

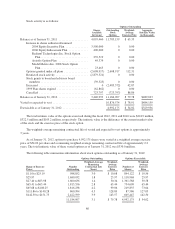
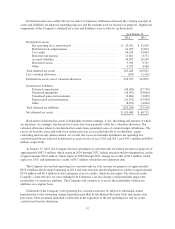
Restricted stock activity is as follows:
Restricted Stock Outstanding
Outstanding
Weighted-
Average
Exercise Price
Aggregate
Intrinsic Value
(in thousands)
Balance as of January 31, 2010 .................... 2,316,452 0.001
Granted ................................... 2,048,925 0.001
Cancelled ................................. (223,220) 0.001
Vested and converted to shares ................ (926,054) 0.001
Balance as of January 31, 2011 .................... 3,216,103 $0.001
Granted ................................... 3,207,805 0.001
Cancelled ................................. (288,959) 0.001
Vested and converted to shares ................ (1,172,686) 0.001
Balance as of January 31, 2012 .................... 4,962,263 $0.001 $579,592
Expected to vest ................................ 4,811,402 $561,972
The restricted stock, which upon vesting entitles the holder to one share of common stock for each share of
restricted stock, has an exercise price of $0.001 per share, which is equal to the par value of the Company’s
common stock, and generally vest over 4 years.
The weighed-average fair value of the restricted stock issued in fiscal 2012 and 2011 was $121.87 and
$108.03, respectively.
The Company reduced its income taxes payable by the tax benefit realized from the exercise, sale or vesting
of the stock options or similar instruments during fiscal 2012 in the amount of $49.0 million. Cash provided by
financing activities due to excess tax benefits from employee stock plans was a result of a portion of such cash
tax benefit.
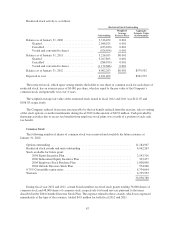
Common Stock
The following number of shares of common stock were reserved and available for future issuance at
January 31, 2012:
Options outstanding ....................................................... 11,184,907
Restricted stock awards and units outstanding .................................. 4,962,263
Stock available for future grant:
2004 Equity Incentive Plan ............................................. 2,543,316
2006 Inducement Equity Incentive Plan ................................... 323,477
2004 Employee Stock Purchase Plan ..................................... 1,000,000
2004 Outside Directors Stock Plan ....................................... 574,200
0.75% Convertible senior notes ............................................. 6,734,664
Warrants ............................................................... 6,735,953
34,058,780
During fiscal year 2012 and 2011, certain board members received stock grants totaling 36,800 shares of
common stock and 48,000 shares of common stock, respectively for board services pursuant to the terms
described in the 2004 Outside Directors Stock Plan. The expense related to these awards, which was expensed
immediately at the time of the issuance, totaled $4.9 million for both fiscal 2012 and 2011.
87