Salesforce.com 2012 Annual Report Download - page 62
Download and view the complete annual report
Please find page 62 of the 2012 Salesforce.com annual report below. You can navigate through the pages in the report by either clicking on the pages listed below, or by using the keyword search tool below to find specific information within the annual report.-
 1
1 -
2
-
3
-
4
-
5
-
6
-
7
-
8
-
9
-
10
-
11
-
12
-
13
-
14
-
15
-
16
-
17
-
18
-
19
-
20
-
21
-
22
-
23
-
24
-
25
-
26
-
27
-
28
-
29
-
30
-
31
-
32
-
33
-
34
-
35
-
36
-
37
-
38
-
39
-
40
-
41
-
42
-
43
-
44
-
45
-
46
-
47
-
48
-
49
-
50
-
51
-
 52
52 -
 53
53 -
 54
54 -
 55
55 -
 56
56 -
 57
57 -
 58
58 -
 59
59 -
 60
60 -
 61
61 -
 62
62 -
 63
63 -
 64
64 -
 65
65 -
 66
66 -
 67
67 -
 68
68 -
 69
69 -
 70
70 -
 71
71 -
 72
72 -
73
-
74
-
75
-
76
-
77
-
78
-
79
-
80
-
81
-
82
-
83
-
84
-
85
-
86
-
87
-
88
-
89
-
90
-
91
-
92
-
93
-
94
-
95
-
96
-
97
-
98
-
99
-
100
-
101
-
102
-
103
-
104
-
105
-
106
-
107
-
108
-
109
-
110
-
111
-
112
-
113
-
114
-
115
-
116
-
117
-
118
-
119
-
120
 |
 |
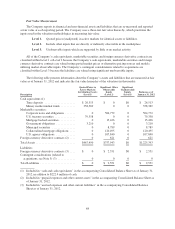
The Notes have a fixed annual interest rate of 0.75% and therefore, we do not have economic interest rate
exposure on the Notes. However, the value of the Notes are exposed to interest rate risk. Generally, the fair
market value of our fixed interest rate Notes will increase as interest rates fall and decrease as interest rates rise.
In addition, the fair value of our Notes is affected by our stock price. The carrying value of our Notes was $496.1
million as of January 31, 2012. This represents the liability component of the $575.0 million principal balance as
of January 31, 2012. The total estimated fair value of our Notes at January 31, 2012 was $869.5 million and the
fair value was determined based on the closing trading price per $100 of the Notes as of the last day of trading
for the fourth quarter of fiscal 2012, which was $151.25.
We have an investment portfolio that includes strategic investments in public and privately-held companies,
many of which are in the development stage. When our ownership interests are less than 20 percent and we do
not have the ability to exert significant influence, we account for investments in non-marketable equity and debt
securities of the privately-held companies using the cost method of accounting. Otherwise, we account for the
investments using the equity method of accounting. As of January 31, 2012 and 2011 the fair value of these
investments was $48.3 million and $21.1 million, respectively.
58