Salesforce.com 2012 Annual Report Download - page 52
Download and view the complete annual report
Please find page 52 of the 2012 Salesforce.com annual report below. You can navigate through the pages in the report by either clicking on the pages listed below, or by using the keyword search tool below to find specific information within the annual report.-
 1
1 -
2
-
3
-
4
-
5
-
6
-
7
-
8
-
9
-
10
-
11
-
12
-
13
-
14
-
15
-
16
-
17
-
18
-
19
-
20
-
21
-
22
-
23
-
24
-
25
-
26
-
27
-
28
-
29
-
30
-
31
-
32
-
33
-
34
-
35
-
36
-
37
-
38
-
39
-
40
-
41
-
 42
42 -
 43
43 -
 44
44 -
 45
45 -
 46
46 -
 47
47 -
 48
48 -
 49
49 -
 50
50 -
 51
51 -
 52
52 -
 53
53 -
 54
54 -
 55
55 -
 56
56 -
 57
57 -
 58
58 -
 59
59 -
 60
60 -
 61
61 -
 62
62 -
63
-
64
-
65
-
66
-
67
-
68
-
69
-
70
-
71
-
72
-
73
-
74
-
75
-
76
-
77
-
78
-
79
-
80
-
81
-
82
-
83
-
84
-
85
-
86
-
87
-
88
-
89
-
90
-
91
-
92
-
93
-
94
-
95
-
96
-
97
-
98
-
99
-
100
-
101
-
102
-
103
-
104
-
105
-
106
-
107
-
108
-
109
-
110
-
111
-
112
-
113
-
114
-
115
-
116
-
117
-
118
-
119
-
120
 |
 |

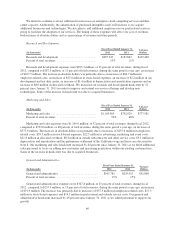
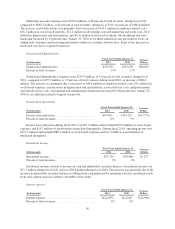
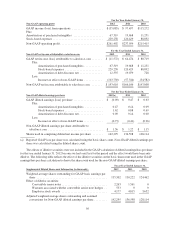
Benefit (provision) for income taxes.
Fiscal Year Ended January 31, Variance
Dollars(In thousands) 2012 2011
Benefit (provision) for income taxes ................... $21,745 $(34,601) $56,346
Effective tax rate .................................. 65% 33%
The benefit for income taxes was $21.7 million during fiscal 2012, compared to an income tax provision of
$34.6 million during the same period a year ago.
Our effective tax rate was 65 percent for fiscal 2012 compared to 33 percent for the same period a year ago.
The higher tax rate was primarily attributable to an increase in federal and California tax credits and a tax benefit
related to the May 2011 acquisition of Radian6. The combined effect of these tax benefits was partially offset by
an increase in foreign tax rate differential. Foreign tax expense relative to our fiscal 2012 pre-tax loss was higher
as compared to foreign tax expense relative to our fiscal 2011 pre-tax income. The combined effect of these
items on a small net loss before income taxes resulted in a comparatively higher fiscal 2012 effective tax rate.
The lower fiscal 2012 state tax rate was primarily attributable to two items. First, California enacted several
income tax law changes, which generally benefited California-based companies. The result of this tax law change
substantially reduced our state effective tax rate. Second, the company was subject to minimum state taxes,
which reduced the state tax benefit. The combined effect of these tax items was an overall small fiscal 2012 state
tax benefit. Note that we separately recorded an income tax expense of $2.2 million in fiscal 2011 to re-value the
anticipated future tax effects of our California temporary differences related to this tax law change.
We also receive certain tax incentives in Switzerland and Singapore in the form of reduced tax rates. These
temporary tax reduction programs will expire in 2016 and 2014 respectively. The Singapore program is eligible
for renewal.
The total income tax benefit recognized in the accompanying consolidated statements of operations related
to stock-based compensation was $76.0 million for fiscal 2012. See Note 6 “Income Taxes” to the Notes to the
Consolidated Financial Statements for our reconciliation of income taxes at the statutory federal rate to the
provision for income taxes.
Fiscal Years Ended January 31, 2011 and 2010
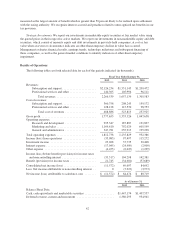
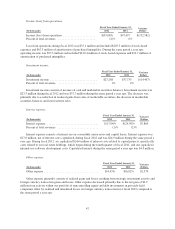
Revenues.
(In thousands)
Fiscal Year Ended January 31, Variance
2011 2010 Dollars Percent
Subscription and support ................... $1,551,145 $1,209,472 $341,673 28%
Professional services and other .............. 105,994 96,111 9,883 10%
Total revenues ........................... $1,657,139 $1,305,583 $351,556 27%
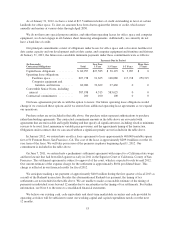
Total revenues were $1.7 billion for fiscal 2011, compared to $1.3 billion during fiscal 2010, an increase of
$351.6 million, or 27 percent. Subscription and support revenues were $1.6 billion, or 94 percent of total
revenues, for fiscal 2011, compared to $1.2 billion, or 93 percent of total revenues, during fiscal 2010. The
increase in subscription and support revenues was due primarily to new customers, upgrades and additional
subscriptions from existing customers and improved renewal rates as compared to fiscal 2010. The price per user
per month for our three primary offerings, Professional Edition, Enterprise Edition and Unlimited Edition, in
fiscal 2011 has generally remained consistent relative to fiscal 2010. Professional services and other revenues
were $106.0 million, or 6 percent of total revenues, for fiscal 2011, compared to $96.1 million, or 7 percent of
total revenues, for fiscal 2010. The increase in professional services and other revenues was due primarily to the
higher demand for services from an increased number of customers.
48