Salesforce.com 2012 Annual Report Download - page 90
Download and view the complete annual report
Please find page 90 of the 2012 Salesforce.com annual report below. You can navigate through the pages in the report by either clicking on the pages listed below, or by using the keyword search tool below to find specific information within the annual report.-
 1
1 -
2
-
3
-
4
-
5
-
6
-
7
-
8
-
9
-
10
-
11
-
12
-
13
-
14
-
15
-
16
-
17
-
18
-
19
-
20
-
21
-
22
-
23
-
24
-
25
-
26
-
27
-
28
-
29
-
30
-
31
-
32
-
33
-
34
-
35
-
36
-
37
-
38
-
39
-
40
-
41
-
42
-
43
-
44
-
45
-
46
-
47
-
48
-
49
-
50
-
51
-
52
-
53
-
54
-
55
-
56
-
57
-
58
-
59
-
60
-
61
-
62
-
63
-
64
-
65
-
66
-
67
-
68
-
69
-
70
-
71
-
72
-
73
-
74
-
75
-
76
-
77
-
78
-
79
-
 80
80 -
 81
81 -
 82
82 -
 83
83 -
 84
84 -
 85
85 -
 86
86 -
 87
87 -
 88
88 -
 89
89 -
 90
90 -
 91
91 -
 92
92 -
 93
93 -
 94
94 -
 95
95 -
 96
96 -
 97
97 -
 98
98 -
 99
99 -
 100
100 -
101
-
102
-
103
-
104
-
105
-
106
-
107
-
108
-
109
-
110
-
111
-
112
-
113
-
114
-
115
-
116
-
117
-
118
-
119
-
120
 |
 |

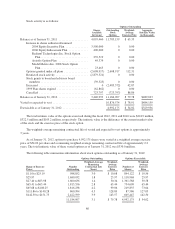
Stock activity is as follows:
Shares
Available
for Grant
Options Outstanding
Outstanding
Stock
Options
Weighted-
Average
Exercise Price
Aggregate
Intrinsic Value
(in thousands)
Balance as of January 31, 2011 .................... 4,095,460 11,783,159 $ 65.35
Increase in shares authorized/assumed:
2004 Equity Incentive Plan ............... 3,500,000 0 0.00
2006 Equity Inducement Plan ............. 400,000 0 0.00
Radian6 Technologies Inc. Stock Option
Plan ................................ 239,519 0 0.00
Assistly Option Plan .................... 49,379 0 0.00
Model Metrics Inc. 2008 Stock Option
Plan ................................ 23,463 0 0.00
Options granted under all plans ................ (2,608,917) 2,608,917 112.31
Restricted stock activity ...................... (2,879,321) 0 0.00
Stock grants to board and advisory board
members ................................ (39,525) 0 0.00
Exercised ................................. 0 (2,483,372) 42.87
1999 Plan shares expired ..................... (62,862) 0 0.00
Cancelled ................................. 723,797 (723,797) 88.86
Balance as of January 31, 2012 .................... 3,440,993 11,184,907 $ 79.78 $489,693
Vested or expected to vest ........................ 10,876,574 $ 78.91 $484,159
Exercisable as of January 31, 2012 ................. 4,992,175 $ 54.02 $329,956
The total intrinsic value of the options exercised during the fiscal 2012, 2011 and 2010 were $224.9 million,
$322.5 million and $105.2 million, respectively. The intrinsic value is the difference of the current market value
of the stock and the exercise price of the stock option.
The weighted-average remaining contractual life of vested and expected to vest options is approximately
3 years.
As of January 31, 2012, options to purchase 4,992,175 shares were vested at a weighted average exercise
price of $54.02 per share and a remaining weighted-average remaining contractual life of approximately 2.2
years. The total intrinsic value of these vested options as of January 31, 2012 was $330.0 million.
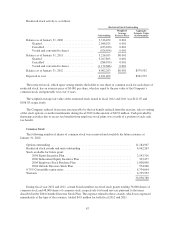
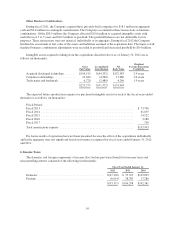
The following table summarizes information about stock options outstanding as of January 31, 2012:
Options Outstanding Options Exercisable
Range of Exercise
Prices
Number
Outstanding
Weighted-Average
Remaining
Contractual Life
(Years)
Weighted-
Average
Exercise
Price
Number of
Shares
Weighted-
Average
Exercise
Price
$1.10 to $25.19 988,852 3.0 $ 10.68 844,122 $ 10.56
$25.97 1,680,032 1.8 25.97 1,118,968 25.97
$27.40 to $63.98 1,600,636 1.4 50.34 1,361,588 50.58
$65.41 to $65.44 1,815,556 2.8 65.44 754,609 65.44
$65.68 to $108.25 1,816,238 4.2 99.06 219,855 73.04
$111.86 to $140.28 860,994 4.5 128.89 87,586 127.05
$142.50 to $151.75 2,422,599 3.9 143.57 605,447 142.50
11,184,907 3.1 $ 79.78 4,992,175 $ 54.02
86