Salesforce.com 2012 Annual Report Download - page 50
Download and view the complete annual report
Please find page 50 of the 2012 Salesforce.com annual report below. You can navigate through the pages in the report by either clicking on the pages listed below, or by using the keyword search tool below to find specific information within the annual report.-
 1
1 -
2
-
3
-
4
-
5
-
6
-
7
-
8
-
9
-
10
-
11
-
12
-
13
-
14
-
15
-
16
-
17
-
18
-
19
-
20
-
21
-
22
-
23
-
24
-
25
-
26
-
27
-
28
-
29
-
30
-
31
-
32
-
33
-
34
-
35
-
36
-
37
-
38
-
39
-
 40
40 -
 41
41 -
 42
42 -
 43
43 -
 44
44 -
 45
45 -
 46
46 -
 47
47 -
 48
48 -
 49
49 -
 50
50 -
 51
51 -
 52
52 -
 53
53 -
 54
54 -
 55
55 -
 56
56 -
 57
57 -
 58
58 -
 59
59 -
 60
60 -
61
-
62
-
63
-
64
-
65
-
66
-
67
-
68
-
69
-
70
-
71
-
72
-
73
-
74
-
75
-
76
-
77
-
78
-
79
-
80
-
81
-
82
-
83
-
84
-
85
-
86
-
87
-
88
-
89
-
90
-
91
-
92
-
93
-
94
-
95
-
96
-
97
-
98
-
99
-
100
-
101
-
102
-
103
-
104
-
105
-
106
-
107
-
108
-
109
-
110
-
111
-
112
-
113
-
114
-
115
-
116
-
117
-
118
-
119
-
120
 |
 |

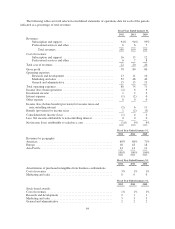
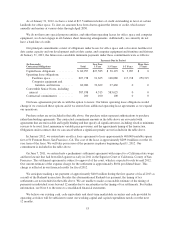
We intend to continue to invest additional resources in our enterprise cloud computing services and data
center capacity. Additionally, the amortization of purchased intangible assets will increase as we acquire
additional businesses and technologies. We also plan to add additional employees in our professional services
group to facilitate the adoption of our services. The timing of these expenses will affect our cost of revenues,
both in terms of absolute dollars and as a percentage of revenues in future periods.
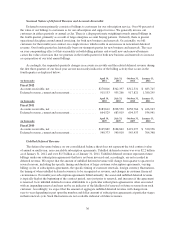
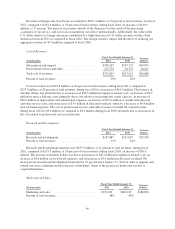
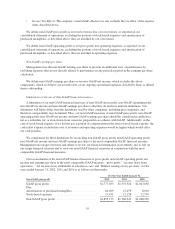
Research and Development.
Fiscal Year Ended January 31, Variance
Dollars(In thousands) 2012 2011
Research and development ......................... $295,347 $187,887 $107,460
Percent of total revenues ........................... 13% 11%
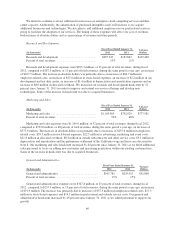
Research and development expenses were $295.3 million, or 13 percent of total revenues, during fiscal
2012, compared to $187.9 million, or 11 percent of total revenues, during the same period a year ago, an increase
of $107.5 million. The increase in absolute dollars was primarily due to an increase of $66.7 million in
employee-related costs, an increase of $27.0 million in stock-based expenses, an increase of $2.2 million in our
development and test data center, an increase of $1.4 million in depreciation and amortization expenses and an
increase of $8.6 million in allocated overhead. We increased our research and development headcount by 52
percent since January 31, 2011 in order to improve and extend our service offerings and develop new
technologies. Some of the increase in headcount was due to acquired businesses.
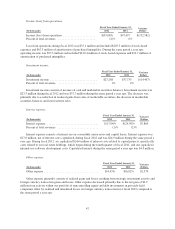
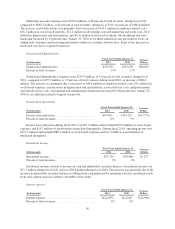
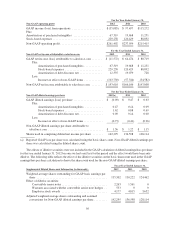
Marketing and Sales.
Fiscal Year Ended January 31, Variance
Dollars(In thousands) 2012 2011
Marketing and sales ............................... $1,169,610 $792,029 $377,581
Percent of total revenues ........................... 52% 48%
Marketing and sales expenses were $1,169.6 million, or 52 percent of total revenues, during fiscal 2012,
compared to $792.0 million, or 48 percent of total revenues, during the same period a year ago, an increase of
$377.6 million. The increase in absolute dollars was primarily due to increases of $255.6 million in employee-
related costs, $59.3 million in stock-based expenses, $22.5 million in advertising, marketing and event costs,
$21.8 million in allocated overhead, $8.2 million in outside subcontractor and other service costs, $3.1 million in
depreciation and amortization and the preliminary settlement of the California wage and hour case discussed in
Note 8. Our marketing and sales headcount increased by 44 percent since January 31, 2011 as we hired additional
sales personnel to focus on adding new customers and increasing penetration within our existing customer base.
Some of the increase in headcount was due to acquired businesses.
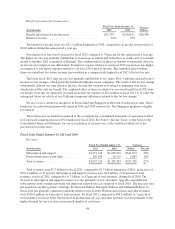
General and Administrative.
Fiscal Year Ended January 31, Variance
Dollars(In thousands) 2012 2011
General and administrative .......................... $347,781 $255,913 $91,868
Percent of total revenues ............................ 15% 15%
General and administrative expenses were $347.8 million, or 15 percent of total revenues, during fiscal
2012, compared to $255.9 million, or 15 percent of total revenues, during the same period a year ago, an increase
of $91.9 million. The increase was primarily due to increases of $57.5 million in employee-related costs, $17.3
million in stock-based expenses and $14.3 million in professional and outside service costs. Our general and
administrative headcount increased by 46 percent since January 31, 2011 as we added personnel to support our
growth.
46