Salesforce.com 2012 Annual Report Download - page 73
Download and view the complete annual report
Please find page 73 of the 2012 Salesforce.com annual report below. You can navigate through the pages in the report by either clicking on the pages listed below, or by using the keyword search tool below to find specific information within the annual report.-
 1
1 -
2
-
3
-
4
-
5
-
6
-
7
-
8
-
9
-
10
-
11
-
12
-
13
-
14
-
15
-
16
-
17
-
18
-
19
-
20
-
21
-
22
-
23
-
24
-
25
-
26
-
27
-
28
-
29
-
30
-
31
-
32
-
33
-
34
-
35
-
36
-
37
-
38
-
39
-
40
-
41
-
42
-
43
-
44
-
45
-
46
-
47
-
48
-
49
-
50
-
51
-
52
-
53
-
54
-
55
-
56
-
57
-
58
-
59
-
60
-
61
-
62
-
 63
63 -
 64
64 -
 65
65 -
 66
66 -
 67
67 -
 68
68 -
 69
69 -
 70
70 -
 71
71 -
 72
72 -
 73
73 -
 74
74 -
 75
75 -
 76
76 -
 77
77 -
 78
78 -
 79
79 -
 80
80 -
 81
81 -
 82
82 -
 83
83 -
84
-
85
-
86
-
87
-
88
-
89
-
90
-
91
-
92
-
93
-
94
-
95
-
96
-
97
-
98
-
99
-
100
-
101
-
102
-
103
-
104
-
105
-
106
-
107
-
108
-
109
-
110
-
111
-
112
-
113
-
114
-
115
-
116
-
117
-
118
-
119
-
120
 |
 |

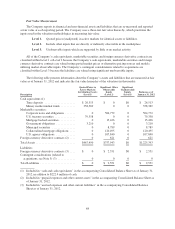
The following table presents the Company’s liabilities that were measured at fair value using significant
unobservable inputs (Level 3) during the fiscal year ended January 31, 2012. These consisted of the Company’s
contingent consideration liabilities related to acquisitions (in thousands):
Balance at February 1, 2011 ........................................................... $17,138
Changes in fair value ................................................................ 262
Payments .......................................................................... (17,400)
Balance at January 31, 2012 ........................................................... $ 0
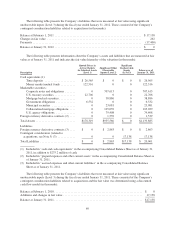
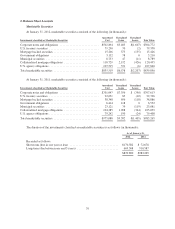
The following table presents information about the Company’s assets and liabilities that are measured at fair
value as of January 31, 2011 and indicates the fair value hierarchy of the valuation (in thousands):
Description
Quoted Prices in
Active Markets
for Identical Assets
(Level 1)
Significant Other
Observable
Inputs (Level 2)
Significant
Unobservable
Inputs
(Level 3)
Balances as of
January 31, 2011
Cash equivalents (1):
Time deposits ..................... $ 26,565 $ 0 $ 0 $ 26,565
Money market mutual funds .......... 122,516 0 0 122,516
Marketable securities:
Corporate notes and obligations ....... 0 707,613 0 707,613
U.S. treasury securities .............. 22,706 0 0 22,706
Mortgage backed securities ........... 0 38,886 0 38,886
Government obligations ............. 6,532 0 0 6,532
Municipal securities ................ 0 23,081 0 23,081
Collateralized mortgage obligations .... 0 105,039 0 105,039
U.S. agency obligations ............. 0 79,408 0 79,408
Foreign currency derivative contracts (2) .... 0 1,539 0 1,539
Total Assets ........................... $178,319 $955,566 $ 0 $1,133,885
Liabilities
Foreign currency derivative contracts (3) .... $ 0 $ 2,863 $ 0 $ 2,863
Contingent consideration (related to
acquisitions, see Note 5) (3) ............ 0 0 17,138 17,138
Total Liabilities ........................ $ 0 $ 2,863 $17,138 $ 20,001
(1) Included in “cash and cash equivalents” in the accompanying Consolidated Balance Sheet as of January 31,
2011, in addition to $275.2 million of cash.
(2) Included in “prepaid expenses and other current assets” in the accompanying Consolidated Balance Sheet as
of January 31, 2011.
(3) Included in “accrued expenses and other current liabilities” in the accompanying Consolidated Balance
Sheet as of January 31, 2011.
The following table presents the Company’s liabilities that were measured at fair value using significant
unobservable inputs (Level 3) during the fiscal year ended January 31, 2011. These consisted of the Company’s
contingent consideration liabilities related to acquisitions and the fair value was determined using a discounted
cash flow model (in thousands):
Balance at February 1, 2010 ............................................................ $ 0
Additions and changes in fair value ...................................................... 17,138
Balance at January 31, 2011 ............................................................ $17,138
69