Salesforce.com 2012 Annual Report Download - page 74
Download and view the complete annual report
Please find page 74 of the 2012 Salesforce.com annual report below. You can navigate through the pages in the report by either clicking on the pages listed below, or by using the keyword search tool below to find specific information within the annual report.-
 1
1 -
2
-
3
-
4
-
5
-
6
-
7
-
8
-
9
-
10
-
11
-
12
-
13
-
14
-
15
-
16
-
17
-
18
-
19
-
20
-
21
-
22
-
23
-
24
-
25
-
26
-
27
-
28
-
29
-
30
-
31
-
32
-
33
-
34
-
35
-
36
-
37
-
38
-
39
-
40
-
41
-
42
-
43
-
44
-
45
-
46
-
47
-
48
-
49
-
50
-
51
-
52
-
53
-
54
-
55
-
56
-
57
-
58
-
59
-
60
-
61
-
62
-
63
-
 64
64 -
 65
65 -
 66
66 -
 67
67 -
 68
68 -
 69
69 -
 70
70 -
 71
71 -
 72
72 -
 73
73 -
 74
74 -
 75
75 -
 76
76 -
 77
77 -
 78
78 -
 79
79 -
 80
80 -
 81
81 -
 82
82 -
 83
83 -
 84
84 -
85
-
86
-
87
-
88
-
89
-
90
-
91
-
92
-
93
-
94
-
95
-
96
-
97
-
98
-
99
-
100
-
101
-
102
-
103
-
104
-
105
-
106
-
107
-
108
-
109
-
110
-
111
-
112
-
113
-
114
-
115
-
116
-
117
-
118
-
119
-
120
 |
 |

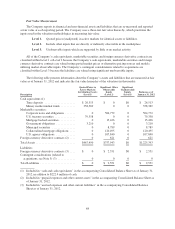
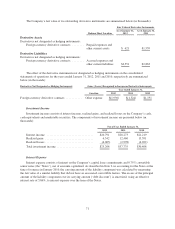
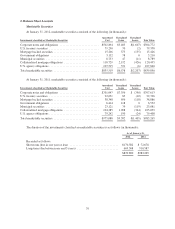
Strategic Investments
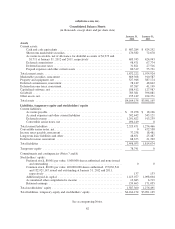
The Company has two investments in marketable equity securities measured using quoted prices in their
respective active markets and certain interests in non-marketable equity and debt securities that are considered
strategic investments. As of January 31, 2012, the fair value of the Company’s marketable equity securities of
$5.6 million includes an unrealized gain of $3.4 million. As of January 31, 2011, the fair value of the Company’s
marketable equity security of $6.0 million includes an unrealized gain of $5.2 million. These investments are
recorded in other assets, net on the consolidated balance sheets.
The Company’s interest in non-marketable equity and debt securities consists of noncontrolling equity and
debt investments in privately-held companies. The Company’s investments in these privately-held companies are
reported at cost or marked down to fair value when an event or circumstance indicates an other-than-temporary
decline in value has occurred. These investments are valued using significant unobservable inputs or data in an
inactive market and the valuation requires the Company’s judgment due to the absence of market price and
inherent lack of liquidity.
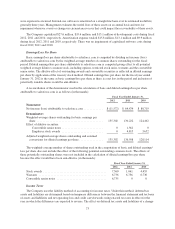
As of January 31, 2012 and 2011 the carrying value that approximates the fair value of the Company’s
investments in privately-held companies was $48.3 million and $21.1 million, respectively. These investments
are recorded in other assets, net on the consolidated balance sheets.
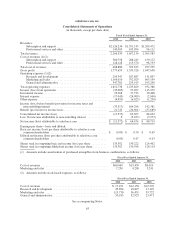
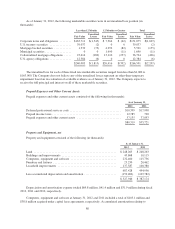
Derivative Financial Instruments
The Company enters into foreign currency derivative contracts with financial institutions to reduce the risk
that its cash flows and earnings will be adversely affected by foreign currency exchange rate fluctuations. The
Company uses forward currency derivative contracts to minimize the Company’s exposure of balances primarily
denominated in Euros, Japanese yen and British pounds. The Company’s foreign currency derivative contracts
which are not designated as hedging instruments are used to reduce the exchange rate risk associated primarily
with intercompany receivables and payables. The Company’s program is not designated for trading or
speculative purposes. As of January 31, 2012 and 2011 the foreign currency derivative contracts that were not
settled are recorded at fair value on the consolidated balance sheets.
Foreign currency derivative contracts are marked-to-market at the end of each reporting period with gains
and losses recognized as other income (expense) to offset the gains or losses resulting from the settlement or
remeasurement of the underlying foreign currency denominated receivables and payables. While the contract or
notional amount is often used to express the volume of foreign currency derivative contracts, the amounts
potentially subject to credit risk are generally limited to the amounts, if any, by which the counterparties’
obligations under the agreements exceed the obligations of the Company to the counterparties.
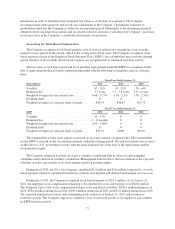
Details on outstanding foreign currency derivative contracts related primarily to intercompany receivables
and payables are presented below (in thousands):
January 31,
2012
January 31,
2011
Notional amount of foreign currency derivative contracts ............... $186,336 $202,491
Fair value of foreign currency derivative contracts .................... $ (1,930) $ (1,324)
70