Salesforce.com 2012 Annual Report Download - page 84
Download and view the complete annual report
Please find page 84 of the 2012 Salesforce.com annual report below. You can navigate through the pages in the report by either clicking on the pages listed below, or by using the keyword search tool below to find specific information within the annual report.-
 1
1 -
2
-
3
-
4
-
5
-
6
-
7
-
8
-
9
-
10
-
11
-
12
-
13
-
14
-
15
-
16
-
17
-
18
-
19
-
20
-
21
-
22
-
23
-
24
-
25
-
26
-
27
-
28
-
29
-
30
-
31
-
32
-
33
-
34
-
35
-
36
-
37
-
38
-
39
-
40
-
41
-
42
-
43
-
44
-
45
-
46
-
47
-
48
-
49
-
50
-
51
-
52
-
53
-
54
-
55
-
56
-
57
-
58
-
59
-
60
-
61
-
62
-
63
-
64
-
65
-
66
-
67
-
68
-
69
-
70
-
71
-
72
-
73
-
 74
74 -
 75
75 -
 76
76 -
 77
77 -
 78
78 -
 79
79 -
 80
80 -
 81
81 -
 82
82 -
 83
83 -
 84
84 -
 85
85 -
 86
86 -
 87
87 -
 88
88 -
 89
89 -
 90
90 -
 91
91 -
 92
92 -
 93
93 -
 94
94 -
95
-
96
-
97
-
98
-
99
-
100
-
101
-
102
-
103
-
104
-
105
-
106
-
107
-
108
-
109
-
110
-
111
-
112
-
113
-
114
-
115
-
116
-
117
-
118
-
119
-
120
 |
 |

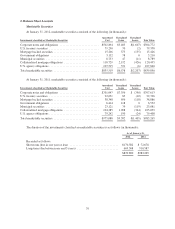
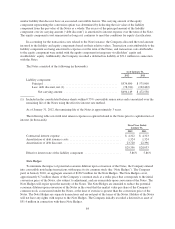
As of January 31, 2012, the following marketable securities were in an unrealized loss position (in
thousands):
Less than 12 Months 12 Months or Greater Total
Fair Value
Unrealized
Losses Fair Value
Unrealized
Losses Fair Value
Unrealized
Losses
Corporate notes and obligations ........ $163,711 $(1,545) $ 7,364 $ (62) $171,075 $(1,607)
U.S. treasury securities ............... 39,037 (2) 0 0 39,037 (2)
Mortgage backed securities ............ 1,339 (73) 4,252 (82) 5,591 (155)
Municipal securities .................. 0 0 1,690 (11) 1,690 (11)
Collateralized mortgage obligations ..... 23,614 (189) 13,110 (237) 36,724 (426)
U.S. agency obligations ............... 12,384 (6) 0 0 12,384 (6)
$240,085 $(1,815) $26,416 $(392) $266,501 $(2,207)
The unrealized loss for each of these fixed rate marketable securities ranged from less than $1,000 to
$163,000. The Company does not believe any of the unrealized losses represent an other-than-temporary
impairment based on its evaluation of available evidence as of January 31, 2012. The Company expects to
receive the full principal and interest on all of these marketable securities.
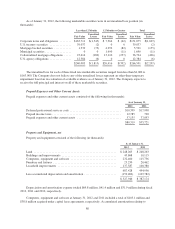
Prepaid Expenses and Other Current Assets
Prepaid expenses and other current assets consisted of the following (in thousands):
As of January 31,
2012 2011
Deferred professional services costs ................................... $10,399 $17,908
Prepaid income taxes ............................................... 12,785 720
Prepaid expenses and other current assets .............................. 57,135 37,093
$80,319 $55,721
Property and Equipment, net
Property and equipment consisted of the following (in thousands):
As of January 31,
2012 2011
Land ........................................................ $248,263 $ 248,263
Buildings and improvements ..................................... 43,868 10,115
Computers, equipment and software ............................... 232,460 115,736
Furniture and fixtures ........................................... 25,250 20,462
Leasehold improvements ........................................ 137,587 100,380
687,428 494,956
Less accumulated depreciation and amortization ...................... (159,482) (107,782)
$ 527,946 $ 387,174
Depreciation and amortization expense totaled $69.8 million, $41.4 million and $31.9 million during fiscal
2012, 2011 and 2010, respectively.
Computers, equipment and software at January 31, 2012 and 2011 included a total of $105.1 million and
$38.8 million acquired under capital lease agreements, respectively. Accumulated amortization relating to
80