Salesforce.com 2012 Annual Report Download - page 83
Download and view the complete annual report
Please find page 83 of the 2012 Salesforce.com annual report below. You can navigate through the pages in the report by either clicking on the pages listed below, or by using the keyword search tool below to find specific information within the annual report.-
 1
1 -
2
-
3
-
4
-
5
-
6
-
7
-
8
-
9
-
10
-
11
-
12
-
13
-
14
-
15
-
16
-
17
-
18
-
19
-
20
-
21
-
22
-
23
-
24
-
25
-
26
-
27
-
28
-
29
-
30
-
31
-
32
-
33
-
34
-
35
-
36
-
37
-
38
-
39
-
40
-
41
-
42
-
43
-
44
-
45
-
46
-
47
-
48
-
49
-
50
-
51
-
52
-
53
-
54
-
55
-
56
-
57
-
58
-
59
-
60
-
61
-
62
-
63
-
64
-
65
-
66
-
67
-
68
-
69
-
70
-
71
-
72
-
 73
73 -
 74
74 -
 75
75 -
 76
76 -
 77
77 -
 78
78 -
 79
79 -
 80
80 -
 81
81 -
 82
82 -
 83
83 -
 84
84 -
 85
85 -
 86
86 -
 87
87 -
 88
88 -
 89
89 -
 90
90 -
 91
91 -
 92
92 -
 93
93 -
94
-
95
-
96
-
97
-
98
-
99
-
100
-
101
-
102
-
103
-
104
-
105
-
106
-
107
-
108
-
109
-
110
-
111
-
112
-
113
-
114
-
115
-
116
-
117
-
118
-
119
-
120
 |
 |

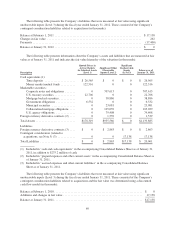
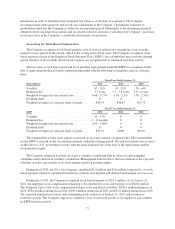
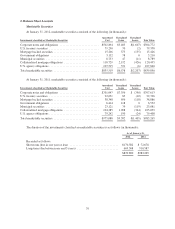
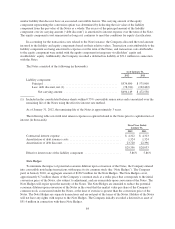
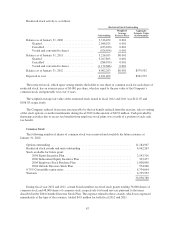
2. Balance Sheet Accounts
Marketable Securities
At January 31, 2012, marketable securities consisted of the following (in thousands):
Investments classified as Marketable Securities
Amortized
Cost
Unrealized
Gains
Unrealized
Losses Fair Value
Corporate notes and obligations ........................... $502,894 $3,485 $(1,607) $504,772
U.S. treasury securities .................................. 79,290 70 (2) 79,358
Mortgage backed securities ............................... 15,206 375 (155) 15,426
Government obligations ................................. 3,132 78 0 3,210
Municipal securities .................................... 8,753 47 (11) 8,789
Collateralized mortgage obligations ........................ 118,729 2,192 (426) 120,495
U.S. agency obligations .................................. 107,515 331 (6) 107,840
Total marketable securities ............................... $835,519 $6,578 $(2,207) $839,890
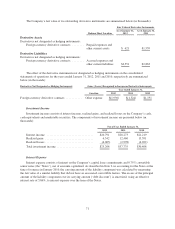
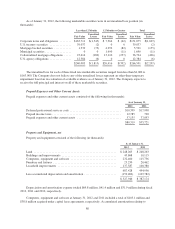
At January 31, 2011, marketable securities consisted of the following (in thousands):
Investments classified as Marketable Securities
Amortized
Cost
Unrealized
Gains
Unrealized
Losses Fair Value
Corporate notes and obligations ........................... $701,047 $7,356 $ (790) $707,613
U.S. treasury securities .................................. 22,631 85 (10) 22,706
Mortgage backed securities ............................... 38,348 656 (118) 38,886
Government obligations ................................. 6,414 118 0 6,532
Municipal securities .................................... 23,121 79 (119) 23,081
Collateralized mortgage obligations ........................ 104,285 1,098 (344) 105,039
U.S. agency obligations .................................. 79,242 190 (24) 79,408
Total marketable securities ............................... $975,088 $9,582 $(1,405) $983,265
The duration of the investments classified as marketable securities is as follows (in thousands):
As of January 31,
2012 2011
Recorded as follows:
Short-term (due in one year or less) ................................. $170,582 $ 72,678
Long-term (due between one and 3 years) ............................ 669,308 910,587
$839,890 $983,265
79