Quest Diagnostics 2007 Annual Report Download - page 68
Download and view the complete annual report
Please find page 68 of the 2007 Quest Diagnostics annual report below. You can navigate through the pages in the report by either clicking on the pages listed below, or by using the keyword search tool below to find specific information within the annual report.-
 1
1 -
2
-
3
-
4
-
5
-
6
-
7
-
8
-
9
-
10
-
11
-
12
-
13
-
14
-
15
-
16
-
17
-
18
-
19
-
20
-
21
-
22
-
23
-
24
-
25
-
26
-
27
-
28
-
29
-
30
-
31
-
32
-
33
-
34
-
35
-
36
-
37
-
38
-
39
-
40
-
41
-
42
-
43
-
44
-
45
-
46
-
47
-
48
-
49
-
50
-
51
-
52
-
53
-
54
-
55
-
56
-
57
-
 58
58 -
 59
59 -
 60
60 -
 61
61 -
 62
62 -
 63
63 -
 64
64 -
 65
65 -
 66
66 -
 67
67 -
 68
68 -
 69
69 -
 70
70 -
 71
71 -
 72
72 -
 73
73 -
 74
74 -
 75
75 -
 76
76 -
 77
77 -
 78
78 -
79
-
80
-
81
-
82
-
83
-
84
-
85
-
86
-
87
-
88
-
89
-
90
-
91
-
92
-
93
-
94
-
95
-
96
-
97
-
98
-
99
-
100
-
101
-
102
-
103
-
104
-
105
-
106
-
107
-
108
-
109
-
110
-
111
-
112
-
113
-
114
-
115
-
116
-
117
-
118
-
119
-
120
 |
 |

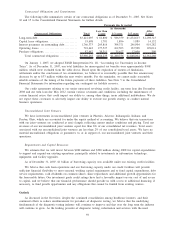
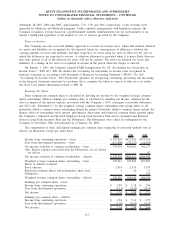
Contractual Obligations and Commitments
The following table summarizes certain of our contractual obligations as of December 31, 2007. See Notes
10 and 15 to the Consolidated Financial Statements for further details.
Contractual Obligations Total
Less than
1 year 1–3 years 3–5 years
After
5 years
(in thousands)
Payments due by period
Long-term debt ............................... $3,421,095 $ 61,800 $ 586,359 $1,474,613 $1,298,323
Capital lease obligations ....................... 19,698 1,781 1,896 1,889 14,132
Interest payments on outstanding debt .......... 1,766,373 205,816 394,371 246,904 919,282
Operating leases .............................. 701,642 177,527 262,503 132,598 129,014
Purchase obligations........................... 87,447 39,311 35,627 12,000 509
Total contractual obligations .............. $5,996,255 $486,235 $1,280,756 $1,868,004 $2,361,260
On January 1, 2007, we adopted FASB Interpretation No. 48, “Accounting for Uncertainty in Income
Taxes”. As of December 31, 2007, our total liabilities for unrecognized tax benefits were approximately $108
million, which were excluded from the table above. Based upon the expiration of statutes of limitations,
settlements and/or the conclusion of tax examinations, we believe it is reasonably possible that this amount may
decrease by up to $33 million within the next twelve months. For the remainder, we cannot make reasonably
reliable estimates of the timing of the future payments of these liabilities. See Note 5 to the Consolidated
Financial Statements for information regarding our contingent tax liability reserves.
Our credit agreements relating to our senior unsecured revolving credit facility, our term loan due December
2008 and our term loan due May 2012 contain various covenants and conditions, including the maintenance of
certain financial ratios, that could impact our ability to, among other things, incur additional indebtedness. We do
not expect these covenants to adversely impact our ability to execute our growth strategy or conduct normal
business operations.
Unconsolidated Joint Ventures
We have investments in unconsolidated joint ventures in Phoenix, Arizona; Indianapolis, Indiana; and
Dayton, Ohio, which are accounted for under the equity method of accounting. We believe that our transactions
with our joint ventures are conducted at arm’s length, reflecting current market conditions and pricing. Total net
revenues of our unconsolidated joint ventures equal less than 6% of our consolidated net revenues. Total assets
associated with our unconsolidated joint ventures are less than 2% of our consolidated total assets. We have no
material unconditional obligations or guarantees to, or in support of, our unconsolidated joint ventures and their
operations.
Requirements and Capital Resources
We estimate that we will invest between $280 million and $300 million during 2008 for capital expenditures
to support and expand our existing operations, principally related to investments in information technology,
equipment, and facility upgrades.
As of December 31, 2007, $1 billion of borrowing capacity was available under our existing credit facilities.
We believe that cash from operations and our borrowing capacity under our credit facilities will provide
sufficient financial flexibility to meet seasonal working capital requirements and to fund capital expenditures, debt
service requirements, cash dividends on common shares, share repurchases and additional growth opportunities for
the foreseeable future. Our investment grade credit ratings have had a favorable impact on our cost of and access
to capital, and we believe that our financial performance should provide us with access to additional financing, if
necessary, to fund growth opportunities and any obligations that cannot be funded from existing sources.
Outlook
As discussed in the Overview, despite the continued consolidation among healthcare insurers, and their
continued efforts to reduce reimbursement for providers of diagnostic testing, we believe that the underlying
fundamentals of the diagnostic testing industry will continue to improve and that over the long term the industry
will continue to grow. As the leading provider of diagnostic testing, information and services with the most
59